Cassandra: Data-Driven Configuration

Spotify currently runs over 100 production-level Cassandra clusters. We use Cassandra across user-facing features, in our internal monitoring and analytics stack, paired with Storm for real-time processing, you name it.
With scale come questions. “If I change my consistency level from ONE to QUORUM, how much performance am I sacrificing? What about a change to my data model or I/O pattern? I want to write data in really wide columns, is that ok?”
Rules of thumb lead to basic answers, but we can do better. These questions are testable, and the best answers come from pre-launch load-testing and capacity planning. Any system with a strict SLA can and should simulate production traffic in staging before launch.
We’ve been evaluating the cassandra-stresstool to test and forecast database performance at Spotify. The rest of this post will walk through an example scenario using cassandra-stress to plan out a new Cassandra cluster.
A CASE STUDY
We’re writing a new service. This service will maintain a set of key-value pairs with two parts:
A realtime pipeline that writes data each time a song is streamed on Spotify. Data is keyed on an anonymous user ID and the name of the feature being written. For example: (12345, currentGenreListened): rock
A client that periodically reads all features for an anonymous id in batch.

Our SLA: We care about latency and operation rate. Strict consistency is not as important. Let’s keep average operation latency at a very low < 5ms at the 95th percentile (for illustration’s sake) and ops/s as high as possible, even at peak load.
The access and I/O patterns we expect to see:
Client setup: Given that we’re writing from a distributed realtime system, we’ll have many clients each with multiple connections.
I/O pattern: This will be write-heavy; let’s say we’d expect a peak operations/second of about 50K for this service at launch, but would like room to scale to nearly twice this.
Column size: We expect values written to columns to be small in size, but expect that this may change.
We’ll use cassandra-stress to determine peak load for our cluster and to measure its performance.
SETUP: CONFIG
Cassandra-stress comes with the default Cassandra installation from Datastax; find it in install_dir/tools/bin. We’re using the version released with Cassandra’s DataStax Community Edition 2.1.
Setup is managed via one file, the .yaml profile, which defines our data model, the “shape” of our data, and our queries. We’ll build this profile in three steps (more detail in the official docs):
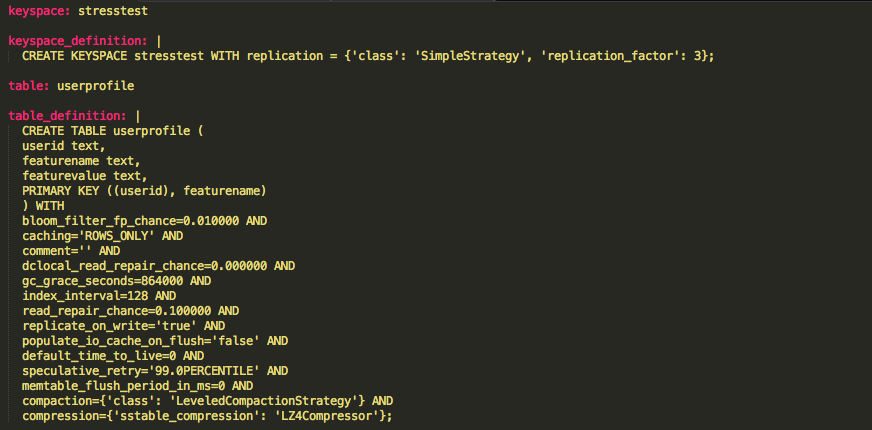
**Dump out the schema:**The first few sections of the profile defining our keyspace and table can be dumped nearly directly from a cql session via describe keyspace. Here’s our setup, which uses mostly default table config values:

Describe data: The columnspec config describes the “shape” of data we expect to see in each of our columns. In our case:
We’ll expect anonymous userids to have a fixed length, from a total possible population of 100M values.
featurename values will vary in length between 5 and 25 characters within a normal (gaussian) distribution, with most in the middle of this range and fewer at the edges. Pull these values from a small population of 4 possible keys.
We’ll have a moderate cluster of possible featurevalues per key. These values also will vary in length.
The columnspec config:

Define queries: Our single query will pull all values for a provided userid. Our data model uses a compound primary key, but the userid is our partition key; this means that any userid query should be a fast single-node lookup.
The queries config:

Note: The fields value doesn’t matter for this query. For queries with multiple bound variables (i.e. multiple ?s; we’ve got just one), fields determines which rows those variables are pulled from.
Insert operations aren’t defined in the yaml – cassandra-stressgenerates these automatically using the schema in our config. When we actually run our tests, we’ll run a mix of our userid query and insert operations to mimic the write-heavy pattern we’d expect to see from our service.
SETUP: TEST PROCESS
A final note on process before we start. Throughout testing, we’ll do the following to keep our data clean:
Drop our keyspace between each test. This clears out any memtables or SStables already holding data from previous tests.
Because we want to ensure we’re really testing our Cassandra cluster, we’ll use tools like htop and ifstat to monitor system stats during tests. This ensures that our testing client isn’t CPU, memory, or network-bound.
Of course, the host running cassandra-stress shouldn’t be one of our Cassandra nodes.
STRESS-TEST
Ready to go. Our first command is:
cassandra-stress user profile=userprofile.yaml ops(insert=24, getallfeatures=1) -node file=nodes
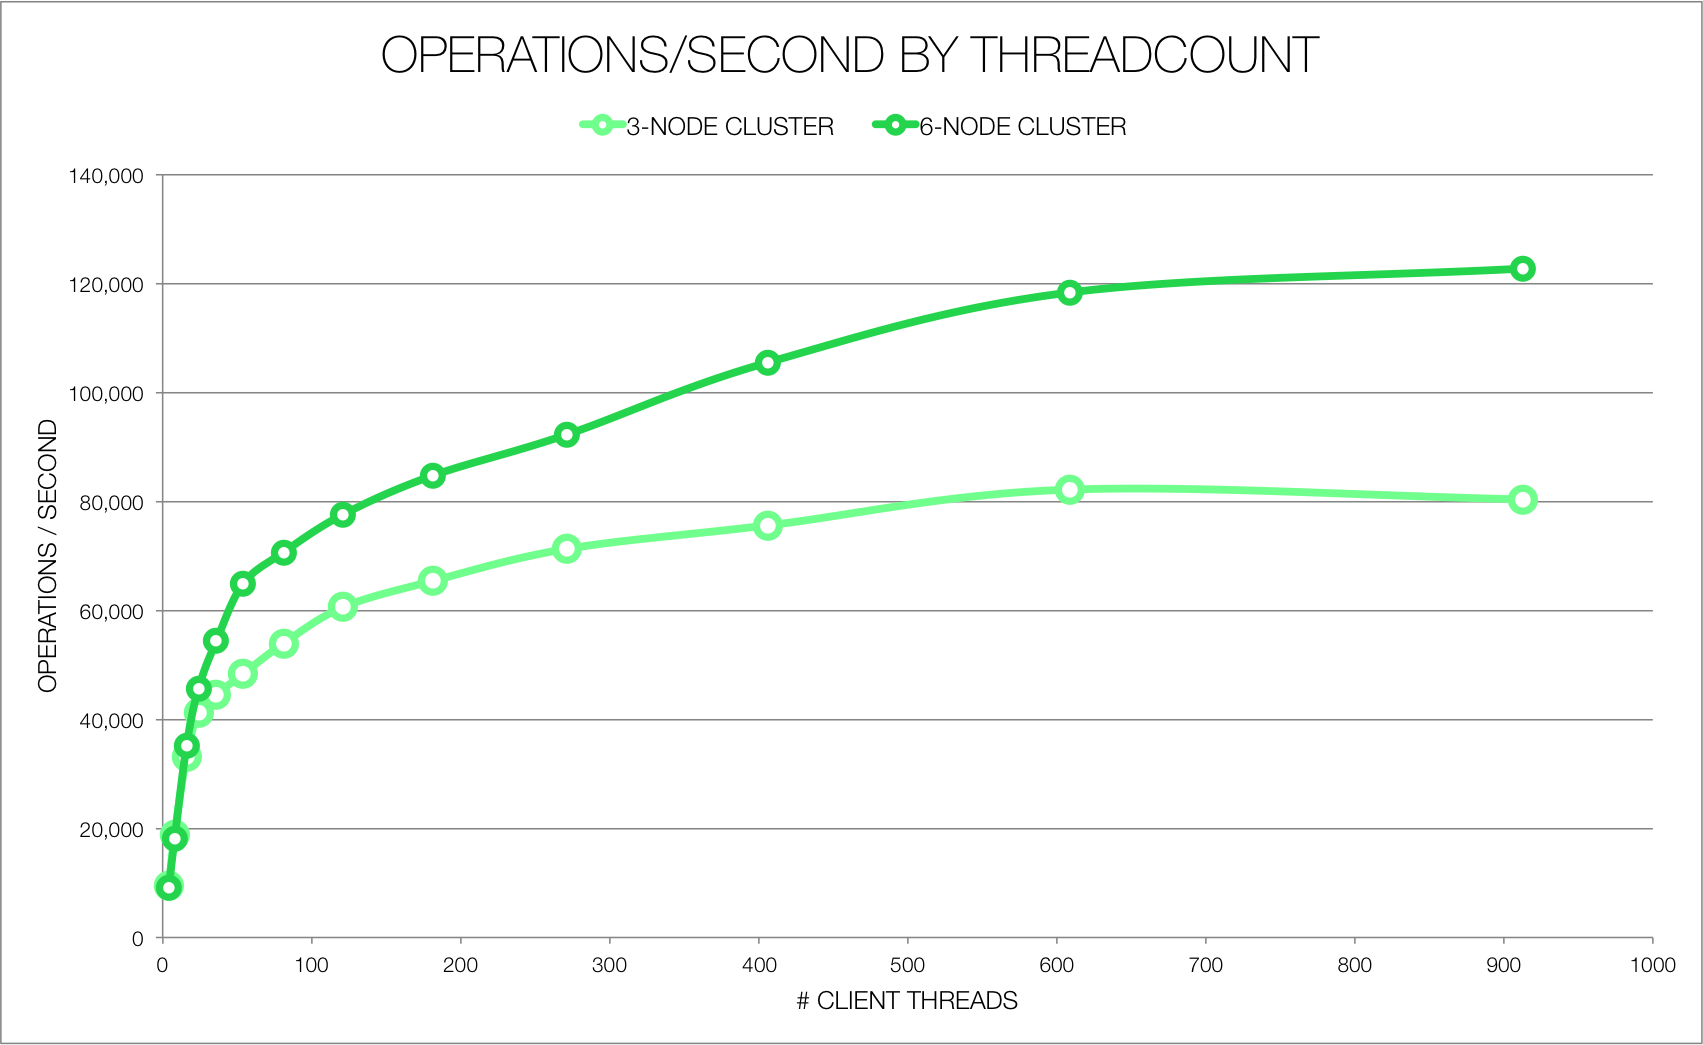
This will kick off a series of tests, each increasing the number of client connections. Because this is all running within one cassandra-stress process, client connection count is called “client threadcount” here. Each test is otherwise identical, with a default consistency level of LOCAL_ONE. We’ve run this this for both a 3 and 6-node cluster with the following output:

Hardware details: The Cassandra cluster for this test consisted of Fusion-io equipped machines with 64GB memory and two Haswell E5-2630L v3 CPUs (32 logical cores). The client machine was equipped with 32GB memory and two Sandy Bridge E5-2630L CPUs (24 logical cores).
Performance mostly increases with client connection count. The relationship between performance and node count isn’t linear; we make better use of the increased node count with more client threads, and a three-node setup actually performs slightly better at 4 – 8 client threads. Interestingly, under a three-node setup we see a slight decrease between 600 and 900 threads, where overhead of managing threads starts to hurt. This decline disappears in a 6-node cluster.
So we’re good up to many client connections. Given that the Datastax Java client creates up to 8 connections per Cassandra machine (depending where the machine is located relative to clients), we could calculate the number of connections we’d expect to create at peak load given our client host configuration.
Next we’ll look at consistency level and column data size. Here we’ll use a fixed number of client threads that we’d expect to use under max load given our setup. We’ll measure just how much performance degrades as we make our consistency level more strict:
cassandra-stress user profile=userprofile.yaml cl=one ops(insert=24, getallfeatures=1) -node file=nodes -rate threads=$THREADCOUNT
# Also ran with ‘cl=quorum’.
And again as we increase the column size about logarithmically, from our baseline’s <100 chars to 1000 to 10000:
cassandra-stress user profile=userprofile_largecols.yaml ops(insert=24, getallfeatures=1) -node file=nodes -rate threads=$THREADCOUNT
# Here a new userprofile_largecols yaml defines the featurename and featurevalue columns as being either 1000 (first test) or 10000 (second test) characters long.
Results tell us just how we’d expect our cluster to perform under these conditions:
With a consistency level of ONE and a 6-node cluster, we’d expect a 95p latency of under 5 ms/op. This meets our SLA. This scenario also provides a high number of ops/s, almost 90k. In fact, we could increase our consistency level to QUORUM with 6 nodes and still meet the SLA.
In contrast, the 3-node cluster fails to meet our SLA even at low consistency. And under either configuration, increasing the size of our columns (for instance, if we began writing a large JSON string in the values field rather than a single value) also takes us out of bounds.
Nice. Enough data to back up our configuration. Other questions regarding performance during compaction or failure scenarios could be tested with a bit more work:
To measure how the cluster performs under a set of failure scenarios: We might simulate downed or fluttering nodes by controlling the Cassandra process via script during additional tests.
**To measure the impact of compaction, repair, GC, and other long-term events or trends:**We might run cassandra-stress over a long period (weeks or months) via script, perhaps in a setup parallel to our production cluster. This would allow us to catch and diagnose any emerging long-term issues and to measure performance during compaction and repair, impossible during the short-term load tests described in this post. This would also ensure that writes hit disk rather than RAM only, as shorter-term tests may do. We’d expect Cassandra’s performance to degrade while under compaction or repair and while reading from disk rather than memory.
Anything missing here? One notable limitation: Cassandra-stress simulates peak load only. We’d need another solution to measure non-peak load or to fire requests at a set non-peak rate. Another: This doesn’t address lost operations or mismatched reads/writes; if a service requires very strict consistency, more testing might be necessary.
In the end, this data-driven configuration allowed us to make several key decisions during setup. We were considering launching with 3 nodes – now we know we need more. We’ve set a bound on column data size. And we’ve got data to show that if we do want to increase consistency from ONE to QUORUM, we can.
A little extra planning and we sleep better knowing we’ll handle heavy traffic day-one.


