Monitoring at Spotify: The Story So Far

This is the first in a two-part series about Monitoring at Spotify. In this, I’ll be discussing our history, the challenges we faced, and how they were approached.
Operational monitoring at Spotify started its life as a combination of two systems. Zabbix and a homegrown RRD-backed graphing system named “sitemon”, which used Munin for collection. Zabbix was owned by our SRE team, while sitemon was run by our backend infrastructure team. Back then, We were small enough that solving things yourself was commonplace. The reason that we took this approach was more because of who picked a problem off the table first rather than anything else.
In late 2013, we were starting to put more emphasis on self service and distributed operational responsibility. We wanted to stop watching individual hosts, and start reasoning about services as a whole. Zabbix was a bad fit due to its strong focus on individual hosts. The only ones who could operate it were SRE folks. The infrastructure was growing –a lot. And so our systems started to crack under the added load.
We tried to bandage up what we could: our Chief Architect hacked together an in-memory sitemon replacement that could hold roughly one month worth of metrics under the current load. While we had somebreathing room, we estimated that we had at most a year until it would become unsustainable. From this experience, a new team was formed: Hero. Their goal was to ‘fix’ monitoring at Spotify and prepare it for the future. Whatever it takes. The following walks through our approach.
Alerting as a service
Alerting was the first problem we took a stab at.
We considered developing Zabbix further. It uses trigger expressions to check for alerting conditions. We observed a lot of bit-rot in the system, and many triggers were running that were hard to understand, broken, or invalid. This prompted us to specify one of the requirements for our next alerting system: It must be easy to test your triggers to increase understanding, and avoid regressions.The scalability of Zabbix was also a concern. We were not convinced that we could operate it at the size we were expecting to be in the coming two years.
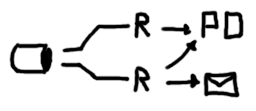
We found inspiration from attending Monitorama EU where we stumbled upon Riemann. A solution that monitors distributed systems. Riemann does not provide scalability out of the box, but its favoring of stateless principles makes it easy to partition and distribute the load. We paired every host in a service with at least two instances that were running the same set of rules.

Every host talks to at least two Riemann instances.
We built a library on top of Riemann called Lyceum. This enabled us to set up a git repository where every squad could put their rules in an isolated namespace. With that setup, our engineers could play around and define reproducible integration tests. It gave us the confidence to open the repo to anyone, and deploy its changes straight into production. Our stance became: If the tests pass, we know it works. This proved to be very successful. Clojure is a vastly more comprehensible language than trigger expressions, and the git-based review process was a better fit for our development methods.
Graphing
We went a few rounds here. Our initial stack was Munin-based with plugins corresponding to everything being collected. Some metrics were standard, but the most important ones were service metrics.
It became desirable to switch to a push-based approach to lower the barriers of entry for our engineers. Our experience with Munin taught us that a complex procedure for defining metrics led to slow adoption. Pull-based approaches need to be configured on what and where to read. With push, you would fire and forget your samples at the closest API, preferably using a common protocol. Consider a short-lived task where there might not be sufficient time for it to be discovered by the collector. For push, this is not an issue since the task itself governs when metrics are sent.
If you want to know more, sFlow and Alan Giles have written good articles examining the topic in more depth.
Our initial experiment was to deploy a common solution based on collectd and Graphite to gather experience. Based on performance tests, we were unsatisfied with the vertical scalability we could get out of one Graphite node.
The whisper write pattern involved randomly seeking and writing across a lotof files – one for each series. There is also a high amortized cost when downsampling everything eagerly.
The difficulties in sharding and rebalancing Graphite became prohibitive. Some of these might have recently been solved using the Cyanite back-end. But Graphite still suffers from a major theoretical hurdle for us: hierarchical naming.
Data Hierarchies
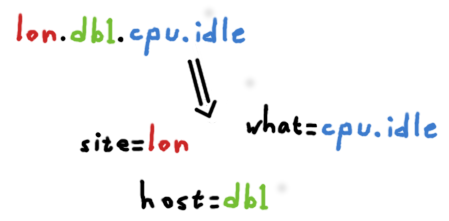
A typical time series in Graphite would be named something like the following:

The exact style varies, but this can bee seen as a fixed hierarchy. For some things this works really well, some things are inherently hierarchical. Consider however, if we want to select all servers in a specific site.
We have two options: we can hope that server name is consistent across our infrastructure and perform wildcard matching; or we could reshuffle the naming hierarchy to fit the problem:

This type of refactoring is hard.
There is no right answer here. One team might require sitesto be the principal means of filtering, another one is interested in roles. Both these requirements may be equal in merit. Therefore the weakness is the naming scheme.
Tags
A completely different school of thought flips the problem around and considers the identity of a time series to be made up of a set of tags.
Looking at our previous example, we would map the existing hierarchy into a set of tags.

With a filtering system that takes this into account it enables engineers to “slice and dice” a large pool of time series by the components attached to each of them. Increasing interoperability.
This way, there is no hierarchy to which we must strictly adhere. They maybe part of the structure by convention (“site” and “host” are always present), but they are neither required nor strictly ordered.
Atlas, Prometheus, OpenTSDB, InfluxDB, and KairosDB are all databases that uses tags. Atlas and Prometheus would have been seriously considered, but were not available at the time. OpenTSDB was rejected because of our poor operational experience with HBase. InfluxDB was immature and lacked features we needed to promote self-service. KairosDB seemed like the best alternative, so we ran an extensive trial. It uncovered performance and stability problems and our attempts to contribute were unsuccessful. We felt the project lacked in community engagement and wasn’t moving in the direction we needed it to.
Inspired by KairosDB we started a new project. A small proof of concept yielded promising results, so we kept going and gave it the name; Heroic.
Stay tuned for the next post tomorrow where I’ll be introducing Heroic, our scalable time series database.
The banner photo was taken by Martin Parm, and is licensed under a Creative Commons Attribution-ShareAlike 2.0 International License.


