Spotify’s Event Delivery – The Road to the Cloud (Part III)

Whenever a user performs an action in the Spotify client—such as listening to a song or searching for an artist—a small piece of information, an event, is sent to our servers. Event delivery, the process of making sure that all events gets transported safely from clients all over the world to our central processing system, is an interesting problem. In this series of blog posts, we are going to look at some of the work we have done in this area. More specifically, we are going to look at the architecture of our new event delivery system, and tell you why we choose to base our new system on Google Cloud managed services.
In thefirst postin this series, we talked about how our old event system worked and some of the lessons we learned from operating it. In thesecond post, we covered the design of our new event delivery system, and why we chooseCloud Pub/Subas the transport mechanism for all events. In this third and final post, we will explain how we intend to consume all the published events with Dataflow, and what we have discovered about the performance of this approach so far.
Exporting events from Pub/Sub to hourly buckets with Dataflow
Most data jobs running in Spotify today are batch jobs. They require events to be reliably exported to a persistent storage. As for persistent storage, we’ve traditionally used Hadoop Distributed File System (HDFS) and Hive. To support Spotify’s growth—measured both in size of stored data and the number of engineers—we’re slowly shifting towards replacing HDFS with Cloud Storage, and Hive with BigQuery.
The Extract, Transform and Load (ETL) job is the component which we’re using to export data to HDFS and Cloud Storage. Hive and BigQuery exports are handled by the batch jobs that are transforming data from hourly buckets on HDFS and Cloud Storage.
All the exported data is being partitioned, based on the event timestamps, to hourly buckets. This is the public interface that was introduced by our very first event delivery system. That system was based on the scp command and it copied hourly based syslog files from all the servers to HDFS.
The ETL job must determine, with high probability, that all data for the hourly bucket has been written to a persistent storage. When no more data for the hourly bucket is expected to arrive, the bucket is marked as complete.
Late-arriving data for already completed bucket can’t be appended to it, since jobs reading the data generally only read data once from a hourly bucket. To cope with this, the ETL job needs to handle late data differently. All late data is written to a currently open hourly bucket, by shifting event timestamp forward to future.
For writing the ETL job, we decided to experiment with Dataflow. This choice was influenced by us wanting to have as little operational responsibility as possible and having others solve hard problem for us. Dataflow is both a framework for writing data pipelines and a fully managed service on Google Cloud for executing those pipelines. It comes with a support for Cloud Pub/Sub, Cloud Storage and BigQuery out of the box.
Writing pipelines in Dataflow feels a lot like writing pipelines using Apache Crunch. This is not a big surprise considering that both projects were inspired by FlumeJava. The difference is that Dataflow offers a unified model for both streaming and batch, while Crunch only has a batch model.
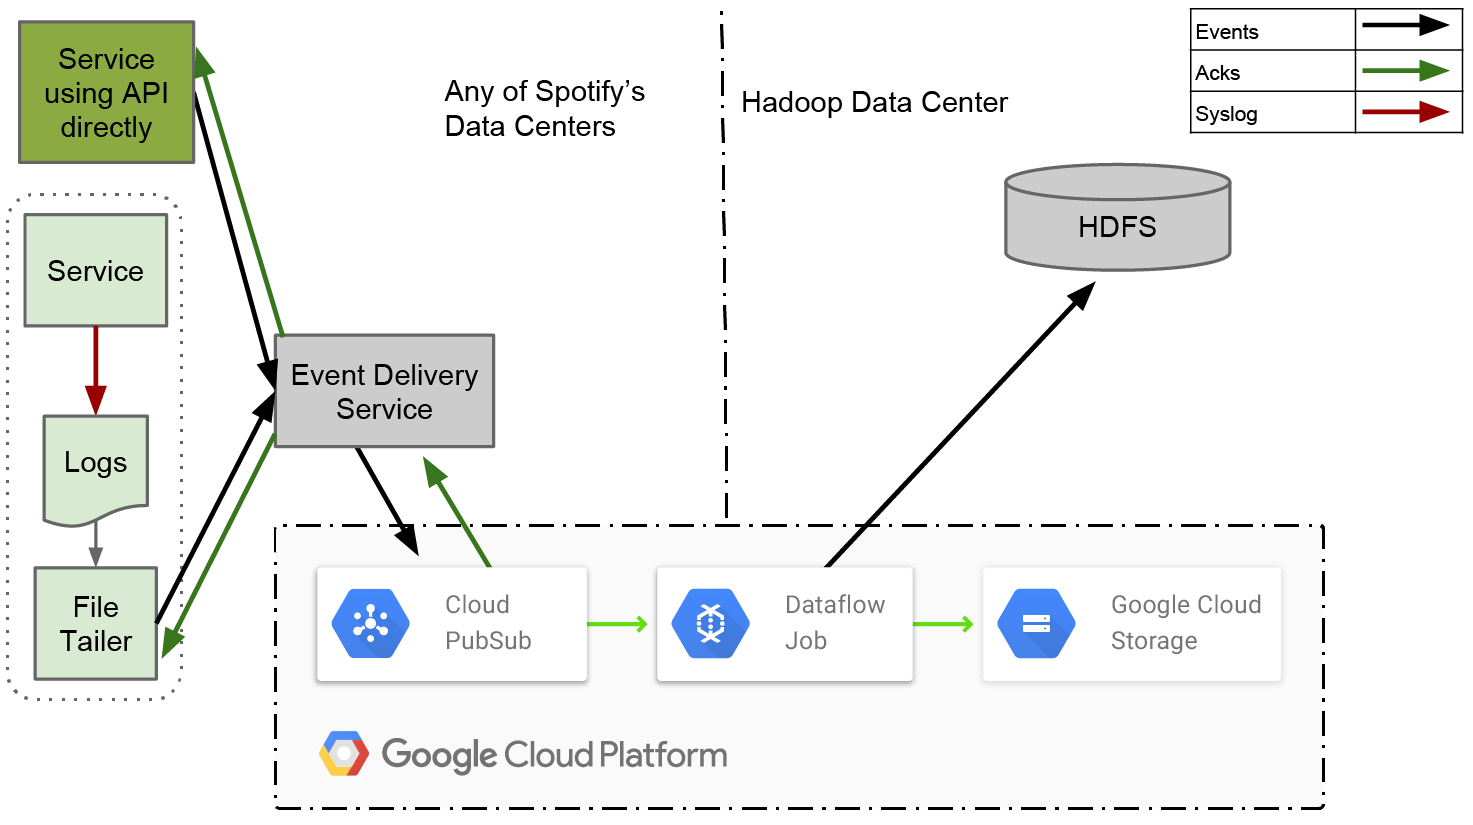
Figure 1. Event delivery system design
To achieve good end-to-end latency, we wrote our ETL as a streaming job. By having it constantly running, we’re able to incrementally fill discrete hourly buckets as the data arrives. This gives us better latency compared to a batch job that exported data once at the end of every hour.
The ETL job is using Dataflow windowing concept to partition data to event time based hourly buckets. In Dataflow, windows can be assigned by both processing and event time. The fact that windows can be created based on event timestamp gives Dataflow advantages compared to other streaming frameworks. So far, only Apache Flink supports windowing in both processing and event time.
Every window consists of one or multiple panes, and every pane contains a set of elements. A trigger, which is assigned to every window, determines how the panes are created. Window panes are only emitted after data is passed through a GroupByKey. Since GroupByKey groups by both key and window, all aggregated elements in a single pane have the same key and belong to the same window. Interestingly, GroupByKey is a memory-bound transform.
Dataflow provides a mechanism called watermark that can be used to determine when to close a window. It uses the event times of incoming data stream to calculate a point in time when it is highly probable that all events for a specific window has arrived.
The ETL implementation deep dive
This section goes into quite a bit of detail with regards to the challenges we encountered building the Dataflow ETL job for event delivery. It might be a bit challenging to approach if you have not had prior experience with Dataflow or similar systems. A good companion text if the concepts and terminology is new to you is theDataFlow paperfrom Google.
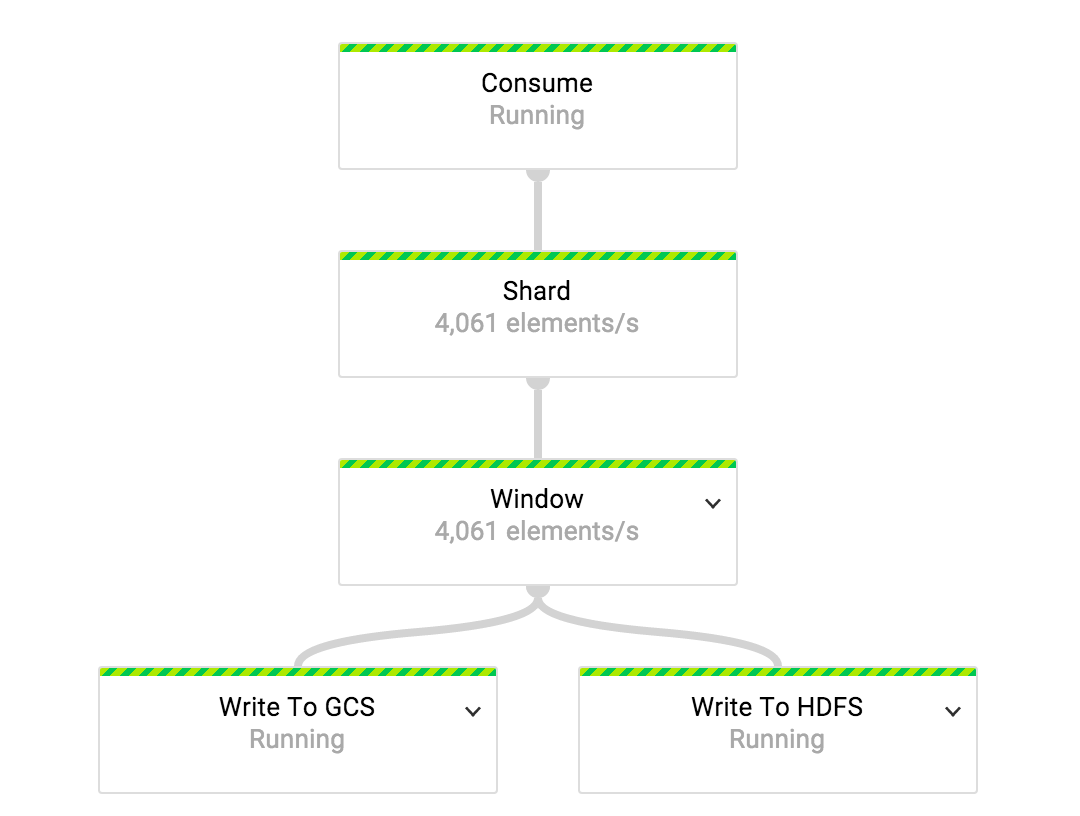
Figure 2. The ETL job pipeline
In our Event Delivery System, we have 1:1 mapping between event types and Cloud Pub/Sub topics. A single ETL job consumes a single event type stream. We use independent ETL jobs to consume data for all the event types.
To distribute load equally across all available workers, data flow is sharded before it reaches the transform that assigns a window to each event. The number of shards that we’re using is a function of the number of workers allocated to the job.
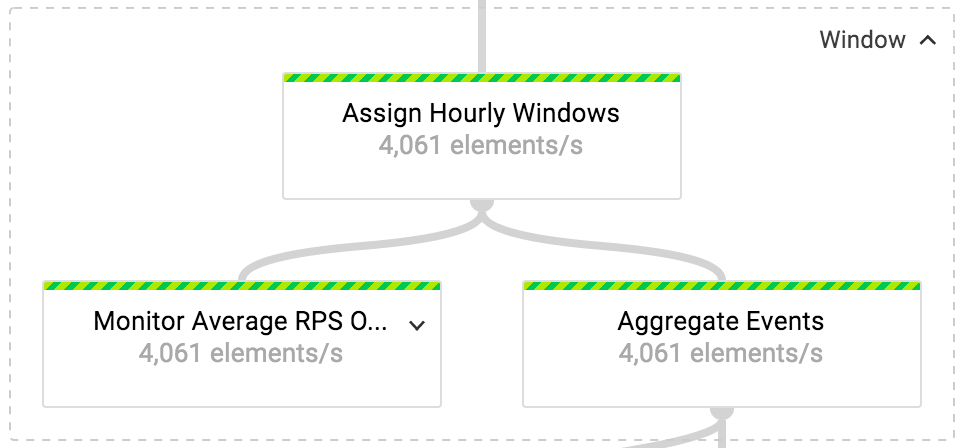
Figure 3. Window transform
“Window” is a composite transform. As the first step in this transform we assign hour-long fixed windows to all events in the incoming stream. Windows are considered closed when the watermark passes the hour boundary.
@Overridepublic
PCollection<KV<String, Iterable<Gabo.EventMessage>>> apply(
    final PCollection<KV<String, Gabo.EventMessage>> shardedEvents) {
  return shardedEvents
      .apply("Assign Hourly Windows",
          Window.<KV<String, Gabo.EventMessage>>into(FixedWindows.of(ONE_HOUR))
              .withAllowedLateness(ONE_DAY)
              .triggering(
                  AfterWatermark.pastEndOfWindow()
                      .withEarlyFirings(
                          AfterPane.elementCountAtLeast(maxEventsInFile))
                      .withLateFirings(AfterFirst.of(
                          AfterPane.elementCountAtLeast(maxEventsInFile),
                          AfterProcessingTime.pastFirstElementInPane()
                              .plusDelayOf(TEN_SECONDS))))
              .discardingFiredPanes())
      .apply("Aggregate Events", GroupByKey.create());
}
Figure 4. The code for “Assign Hourly Windows” transform
When assigning windows, we have an early trigger that is set to emit panes every Nelements until the window is closed. Thanks to the trigger, hourly buckets are continually filled as the data arrives. Having the trigger configured like this help us not only with achieving lower export latency but it also is a workaround the GroupByKey limitations. The amount of data that is collected in panes need to fit into the memory on the worker machines, since GroupByKey is a memory-bound transform.
When the window is closed, pane production is orchestrated with a late trigger. The late trigger creates panes of data either after every Nelements or after ten seconds of processing time. The events are dropped if they are more than one day late.
Materialization of panes is done in “Aggregate Events” transform which is nothing else than a GroupByKey transform.
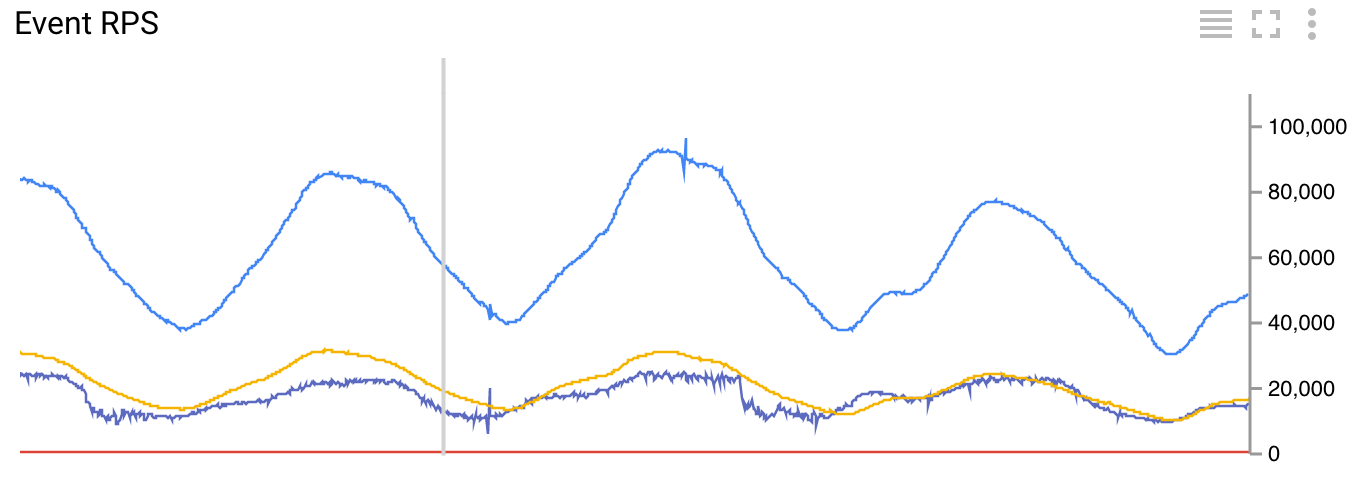
Figure 5. Number of incoming events per second
To monitor the number of incoming events per second flowing through the ETL job, we apply a “Monitor Average RPS Of Timely And Late Events” to the output of “Assign Hourly Windows”. All metrics from this transform are sent, as custom metrics, to Cloud Monitoring. The metrics are calculated on sliding windows of five minutes which are emitted every minute.
Event timeliness information can be obtained only after event has been assigned to a window. Comparing the element’s window maximum timestamp with the current watermark gives us that information. Since the watermark propagation isn’t synchronized between transforms, detecting timeliness in this way can be inaccurate. The number of falsely detected late events we’re observing today is fairly low: less than one per day.
We could perfectly detect event timeliness if the monitoring transform would be applied to the output of “Aggregate Events”. The drawback of this approach would be the unpredictability of when the metrics are emitted, since the window trigger is based on the number of elements and the event time.

Figure 6. “Write to HDFS/GCS” transform
In “Write to HDFS/GCS” transform, we write data either to HDFS or Cloud Storage. The mechanics for writing data to Cloud Storage and HDFS are the same. The only difference is the underlying file system API used. In our implementation, both APIs are hidden behind the IOChannelFactory interface.
To guarantee that only a single file is written for a pane, even in the face of failures, every emitted pane gets a unique ID assigned to it. The pane ID is then used as a unique ID for all written files. Files are written in Avro format with a schema that corresponds to the event’s schema ID.
Timely panes are written to buckets that are determined by the event time. Late panes are written to buckets that belong to the current hour since backfilling completed buckets isn’t desirable in the Spotify data ecosystem. To detect if the pane was on time, we use the PaneInfo object. It’s constructed when the pane is created.
A completeness marker for the hourly buckets is written only once. Main output from “Write Pane” is re-windowed into hourly window and aggregated with “Aggregated Write Successes” to achieve this.
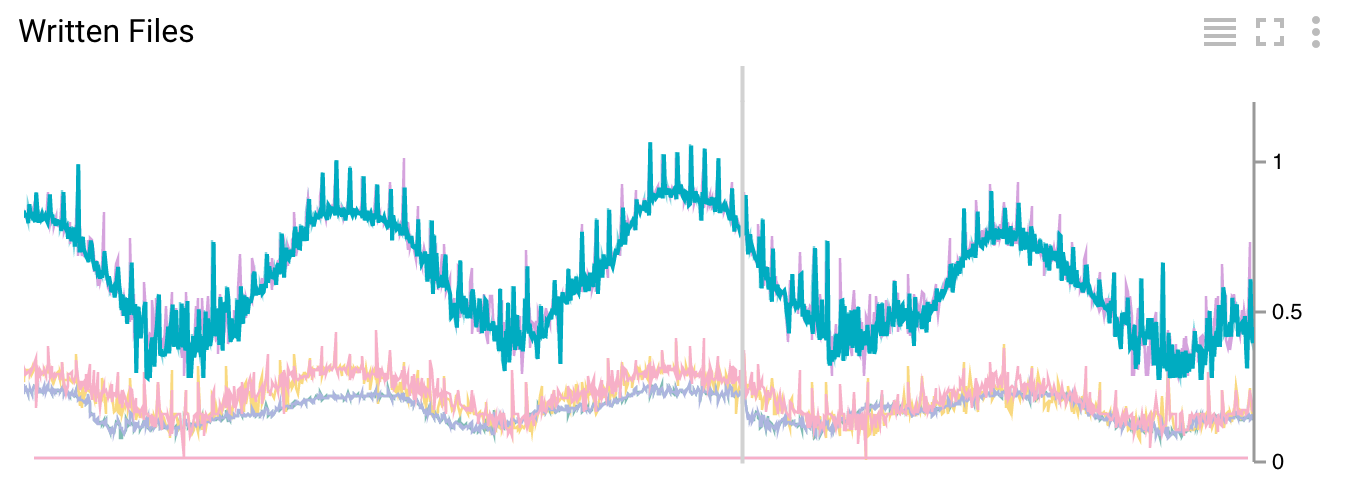
Figure 7. Number of written files per second
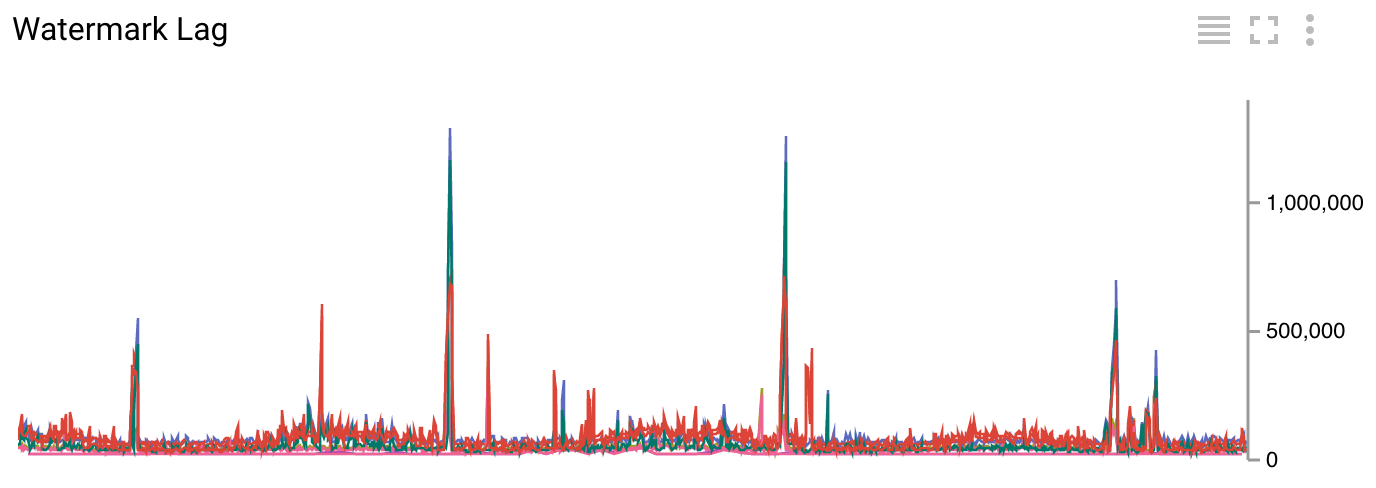
Figure 8. Watermark lag in milliseconds
Metrics are emitted as a side outputs of “Write Pane”. We emit metrics that show how many files were written per second, the average lateness of events, and the lag of the watermark compared to the current time. All these metrics are calculated on sliding windows that are 5 minutes long and are emitted every minute.
Since the watermark lag is measured after we write files to HDFS/Cloud Storage, it directly corresponds to end-to-end latency of the system. From Figure 8 it can be seen that current watermark lag is mostly below 200s (~3.5 mins). You can see occasional spikes up to 1500s (~25 mins) in the same figure. Big spikes are caused by flakiness when writing to our Hadoop cluster over a VPN connection. To put this in perspective, the end-to-end latency of our current event delivery system is two hours on a perfect day, three hours on an average one.
ETL Job Next Steps
The ETL job implementation is in a prototyping phase. Currently, we have four ETL jobs running (see Figure 5). The smallest job consumes around 30 events per second, while the largest peaks at around 100k events per second.
We have not yet found a good way of calculating the optimal number of workers for the ETL job. Worker numbers are set up manually after some trial and error. We use two workers for the smallest job and 42 workers for the largest. It is interesting to note that the job performance is also influenced by memory. For one pipeline, which handles around 20k events per second, we use 24 workers, while for a second pipeline handling events at the same rate but with an average message size that is four times smaller we use only 4 workers. Managing pipelines should be much easier when the auto scaling functionality is released.
We must ensure that when a job is restarted, we don’t lose any in flight data. This is not the case today if the job update doesn’t work. We’re actively collaborating with Dataflow engineers on finding the solution for this issue.
The watermark behaviour is still a mystery to us. We still need to verify that the watermark calculation has predictable behaviour both during the disaster scenarios and happy path scenarios.
Lastly, we need to define a good CI/CD model to enable fast and safe iterations on the ETL job. This isn’t trivial task to do: we need to manage one ETL job per event type, and we have roughly 1000 event types.
Event Delivery System In Cloud
We’re actively working on bringing the new system to production. The preliminary numbers we obtained from running the new system in the experimental phase look very promising. The worst end-to-end latency observed with the new system is four times lower than the end-to-end latency of old system.
But boosting performance isn’t the only thing we want to get from the new system. Our bet is that by using cloud-managed products we will have a much lower operational overhead. That in turn means we will have much more time to make Spotify’s products better.


