Spotify’s New Experimentation Platform (Part 1)

At Spotify we try to be as scientific as possible about how we build our products. Teams generate hypotheses that we test by running experiments — normally in the form of an A/B test — to learn what works and what doesn’t. The learnings give us insights and fuel new product ideas.
Want to know why Spotify decided to build a new Experimentation Platform and how it works? In this two-part series, we’ll share what led us to throw out our old A/B testing platform (called ABBA) and details around the new architecture we’ve chosen to substitute it.
Early days
Today almost all product decisions are made with some input from one or more A/B tests. But it hasn’t always been like that. Back when Spotify was a small startup in Sweden, a team, simply called Analytics, played around with various kinds of tests.
Over time, interest in A/B testing grew, and in 2013 we decided to spin up a team to take on building a more robust system. Thus was born ABBA, an A/B testing system that allowed us to (more) easily run experiments. Now we had a place to see what A/B tests were actually running, and a pipeline that computed results. The introduction of the system was a step change in productivity, and over time it was integrated into pretty much every aspect of Spotify — in our desktop clients and mobile clients, backend services and data pipelines, in-app messaging, and email campaigns.
ABBA as a system was quite simple. Each experiment (or rollout) mapped one to one to a feature flag, named after the experiment. When a client fetched the value of the feature flag it got back the name of the treatment group — e.g., “Control” or “Enabled” or “Sort according to color” — anything the user decided to name the group. (Fun trivia: some users of ABBA started encoding more elaborate configurations as JSON in the group names. Life finds a way). Every time a feature flag value was resolved, an event was logged, which fed into the exposure and results pipelines. For each experiment, only a small number of metrics were calculated. Many of these metrics were not very sensitive, leading to almost all analysis being performed manually in notebooks.
Why we decided to build a new system
Around 2017, the system began to reveal its limitations. We had a few big projects that required a lot of experimentation, and the sentiment at the company was that the system needed to improve.
At a hack week in late 2017, a few senior engineers gathered to sketch out a new system, which aimed to address the following challenges (as well as some others):
Reduce Time: The 1-1 mapping between an experiment and the feature flag led to some interesting side effects. If there were a problem with the experiment (and often there were) and it needed to be restarted, we simply couldn’t just … restart it. A new experiment would have to be created, and the software would need to be updated to use the new feature flag. The new system would have to reduce the time it took to complete this cycle.
Produce less events: The volume of events that were logged by the A/B testing system had over time grown to almost 25% of our total event volume. This drove up the cost of processing, and the volume of events caused incidents in the event delivery system.
Improved analysis: The metrics that ABBA provided out of the box were no way near enough for our analysis needs, and our data scientists were getting tired of performing analyses in notebooks. It was time consuming, and we also didn’t have any consistency across the company when it came to how experiments were analyzed. The new system would have to allow us to add custom metrics and we needed a solid analysis methodology.
Sophisticated coordination: Over time our needs for how we allocated users to experiments changed, which was done manually by coordinating bucket ranges between teams. This was of course error prone — if someone ended up using the wrong buckets a whole slew of experiments would be impacted; the new system would have to address this.
The Experimentation Platform
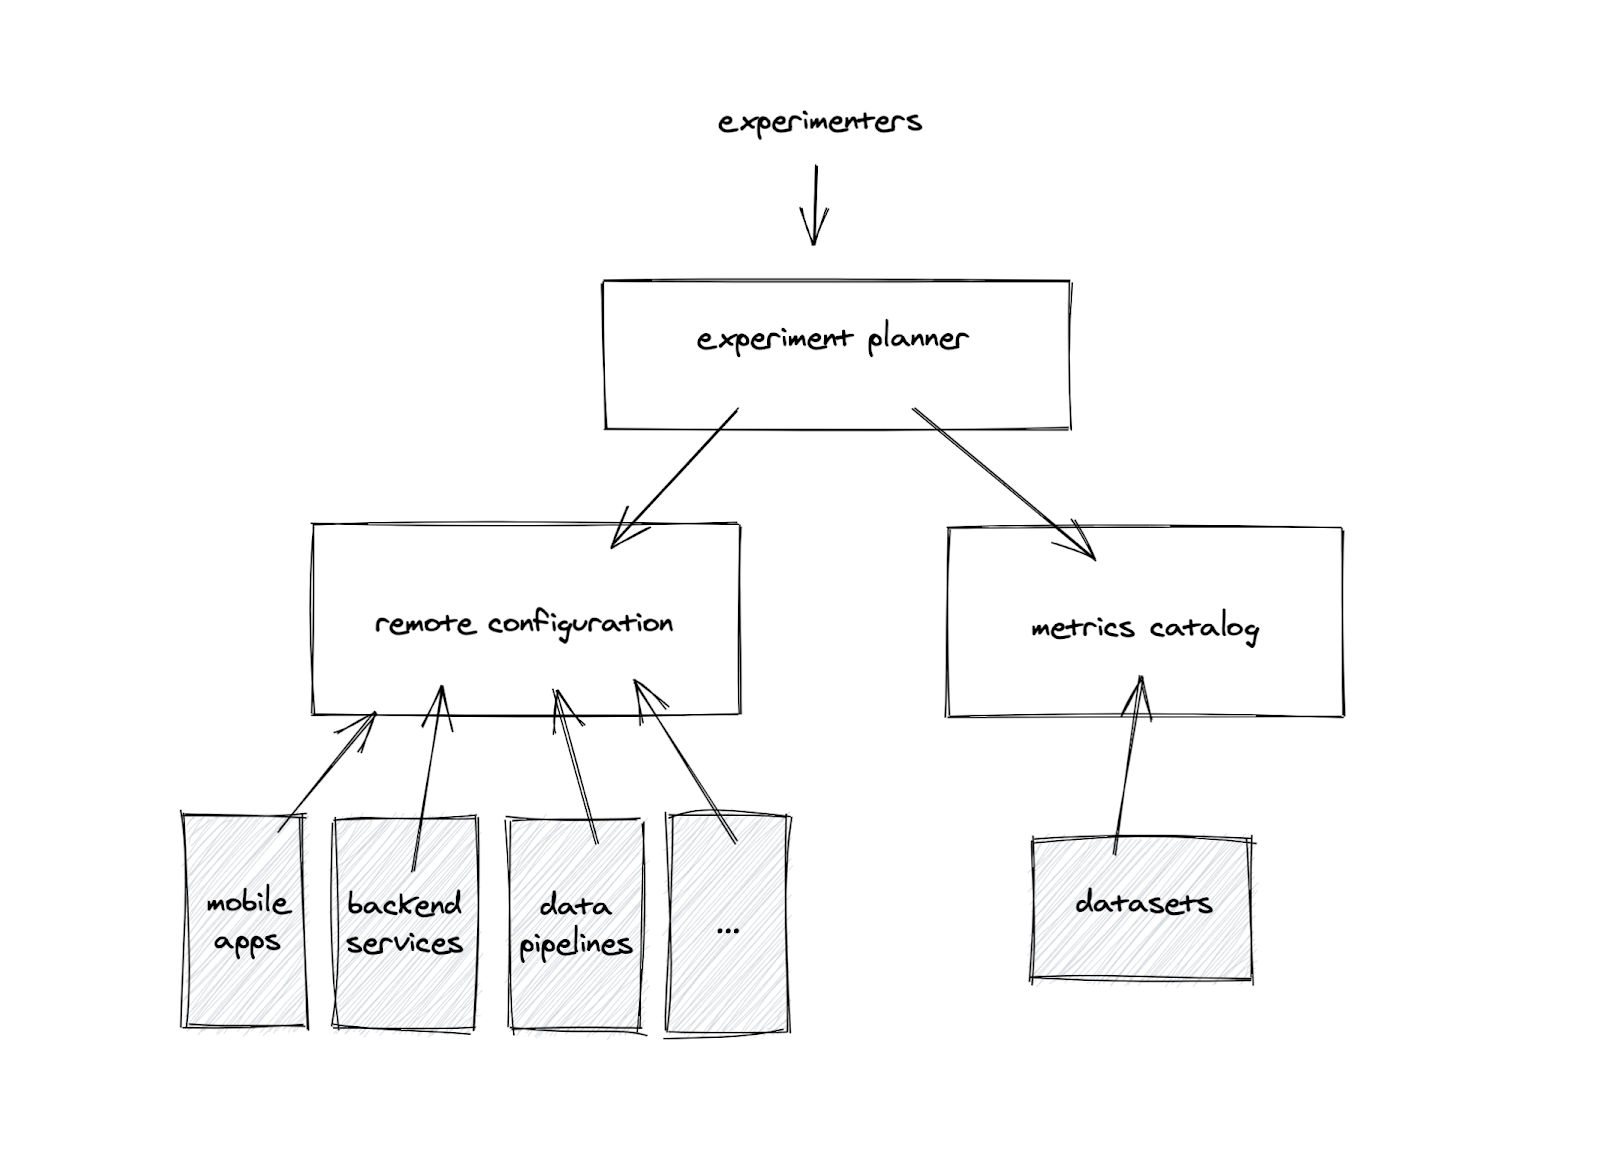
The new experimentation system, dubbed “The Experimentation Platform”, is composed of three parts:
Remote Configuration – replaces our feature-flagging service. Instead of “flags”, its model is based on “properties” — a configurable aspect of one of our clients or backend services. An example of a property could be the color of our buttons, or the number of tracks in the top list.
Metrics Catalog – a managed environment for running SQL pipelines to ingest metrics into a data warehouse, from where data can be served with sub-second latency to UIs and notebooks.
Experiment Planner – manages and orchestrates experiments. This is the part of the platform users interact with when they want to run an experiment.
Remote Configuration
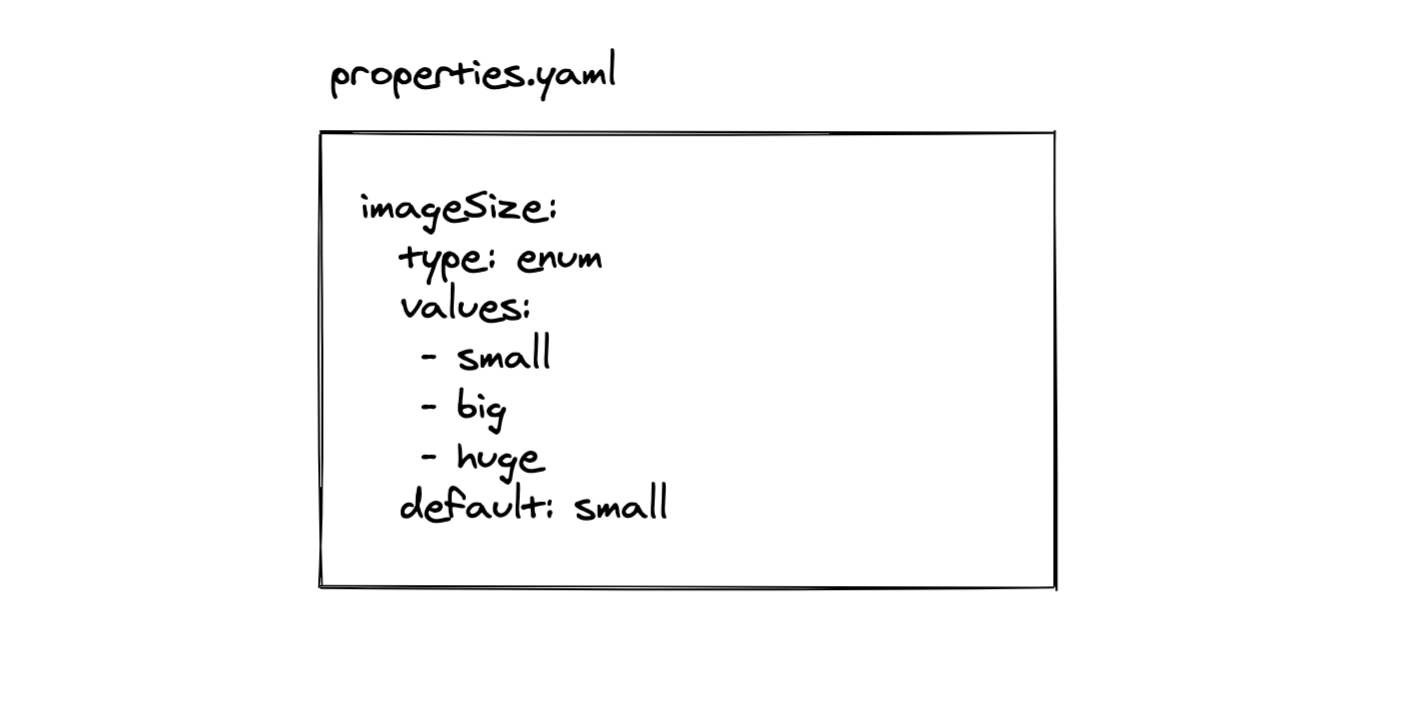
Remote Configuration is a way to change the experience a user receives. This is done through controlling the values of a set of “properties” of the client. A property is a variable with a type (enum or integer) and a default value, and can represent the appearance or behavior of pretty much anything.
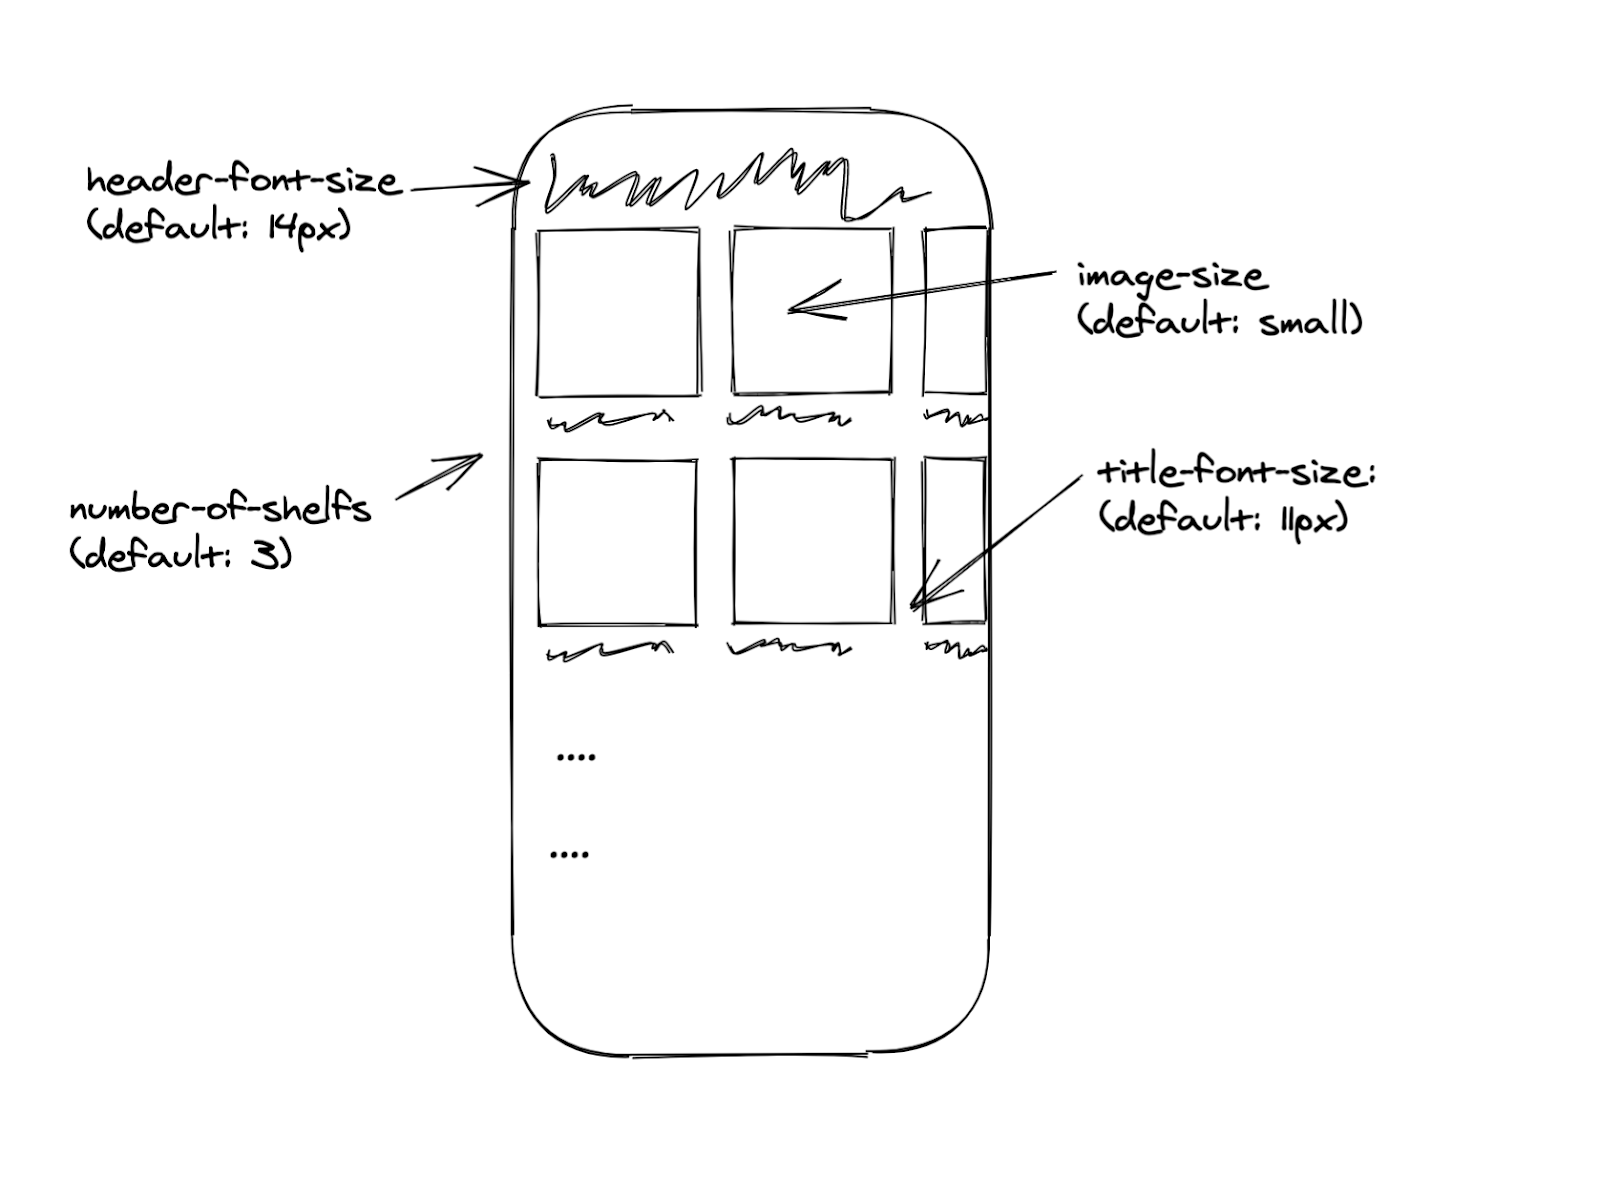
The example above shows an imaginary version of Spotify’s home page in our mobile apps. It’s made up of a set of shelves, and each shelf has a set of cards. With Remote Configuration properties we can control elements for any purpose, i.e. the number of shelves or font sizes on the home page for experiments, rollouts, or personalization or localization.
The properties are defined in a yaml file living next to the code that uses it. When the code is built, all properties and their default values are gathered and published via an API to the admin interface together with the ID of the client being built and the version number.
The default value is critical. It allows us to have a programmatic understanding of what the end user experience will be if a client fails to fetch or apply property values. Also, we only have to transfer values to the client when they differ from the default, which saves a lot of time and data traffic when the client starts up. We know what defaults a client has since it identifies itself with the version number.
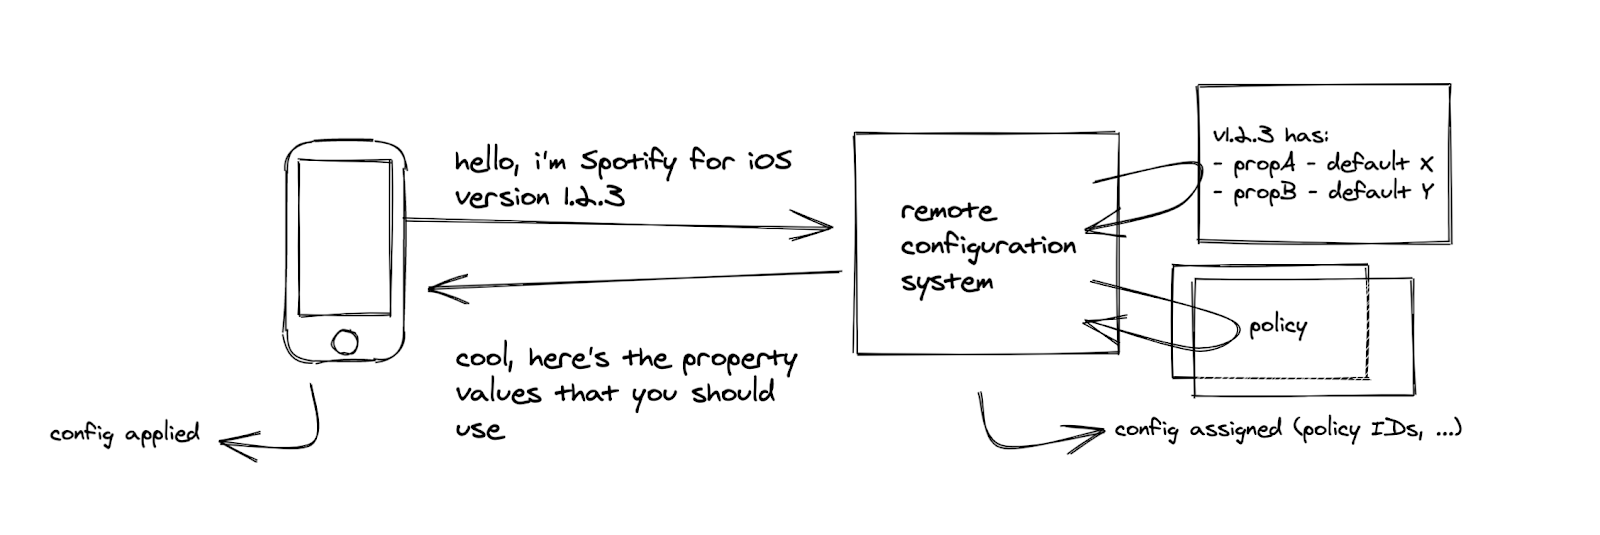
The way different users get different values for properties is through a set of policies that is evaluated when a client requests the configuration. The policy has a set of filtering criteria and a property-value mapping to apply if the filters match. The actual implementation of the policy is a PlanOut script that the Remote Configuration service executes.
An important side effect of the fetching of property values is that two events are being logged:
Config Assigned, which lets us know that a user has fetched its values. Besides user information, this log message also identifies which policies were applied. This information is later used to determine which experiments a user was exposed to.
Config Applied, which lets us know that the device has actually started using the property values. We use this event as the trigger event for exposure.
Property values are re-fetched in the background at regular intervals, but are only applied when the app is relaunched. The main reason for this is that we do not want the user experience to change mid-session.
Metrics Catalog
The Metrics Catalog is where we manage, store, and serve metrics to the Experimentation Platform.
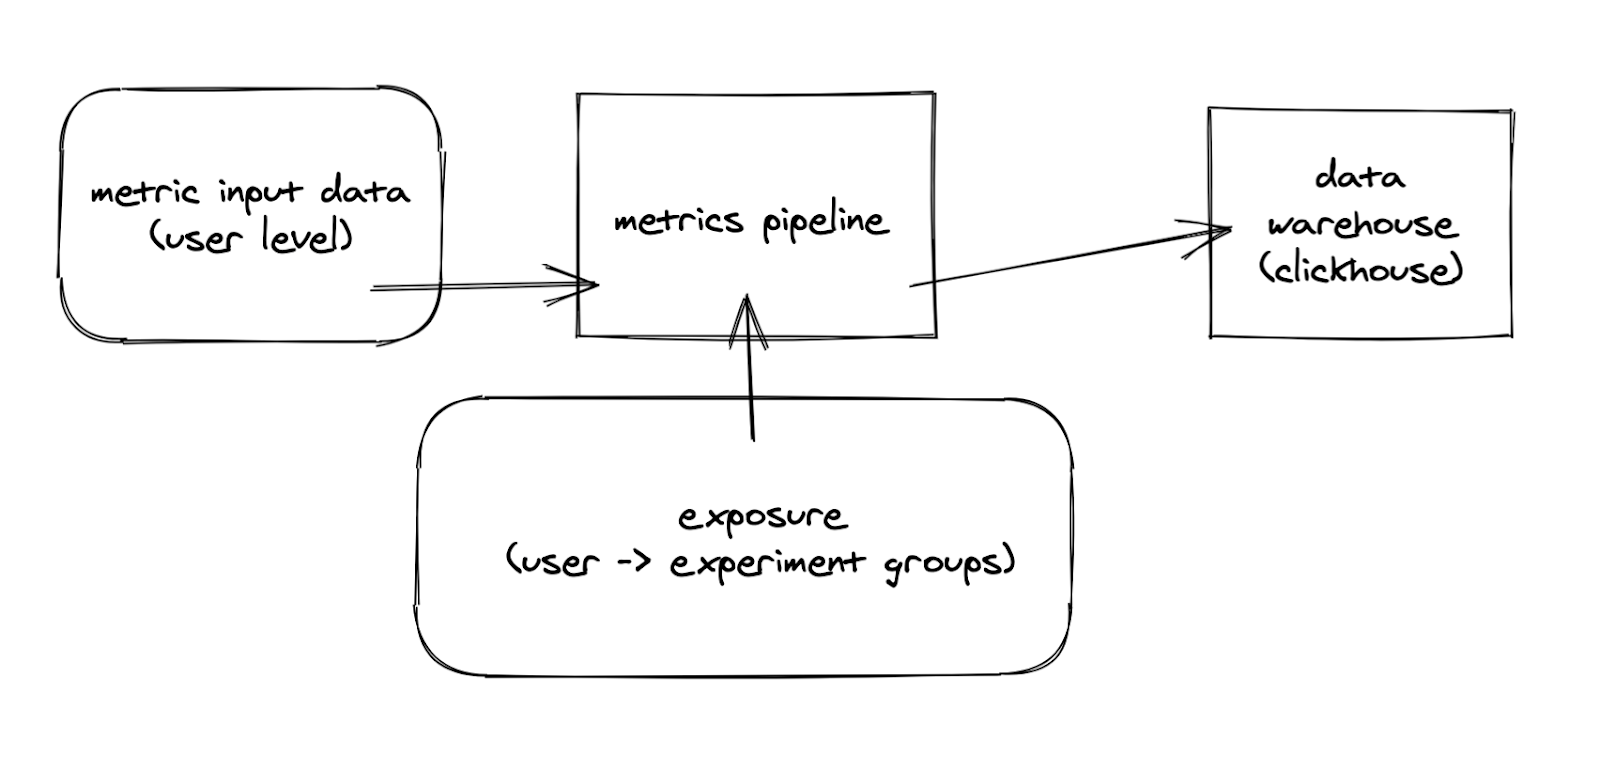
On a high level, raw metric data is fed into a pipeline where it’s joined with information on which experiment groups a user belongs to. This data is then aggregated into a OLAP cube and put into a data warehouse. In front of the data warehouse sits an API that allows other parties to query for information without knowing too much about the underlying storage.
Exposure is assembled from the Config Assigned and Config Applied messages from Remote Configuration.
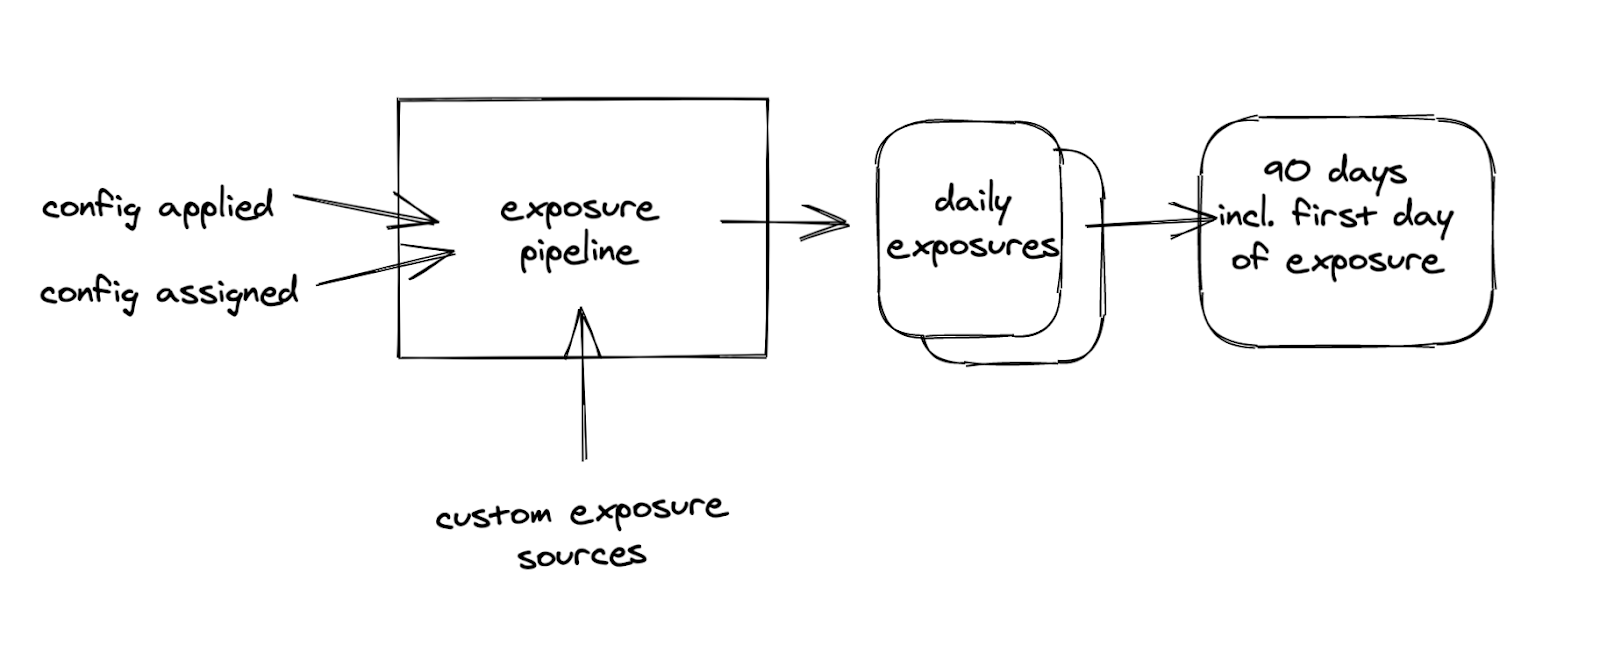
A user is considered exposed to an experiment if the following is true:
We have a Config Assigned event that assigns the user to one of the groups in the experiment,
AND
We have a Config Applied event that tells us that the user started using the configuration of the experiment.
AND OPTIONALLY
The user exists in one specified “custom exposure source”.
The custom exposure sources allow us to define finer-grained exposure events, such as when a user visited a certain page in the mobile app.
Experiment Planner
The Experiment Planner sits as an orchestrating layer on top of Metrics Catalog and Remote Configuration. This is where we create, launch, and stop experiments, as well as analyze test results. The UI lives in Backstage, our developer portal. All of our internal teams have access to our internal instance of Backstage and are free to create as many experiments as they like.
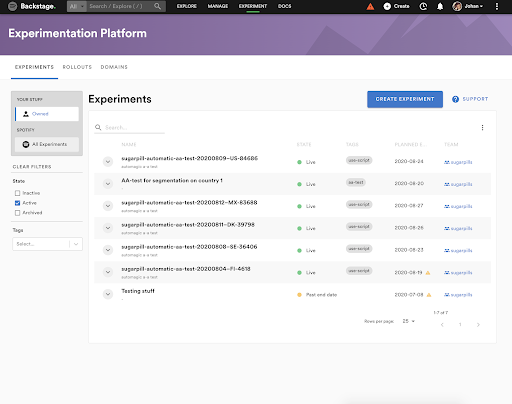
For illustrative purposes only.
When creating an experiment, we have to define the test treatments, what experience users should get for each treatment (by specifying property values), and all the things that go into testing the hypothesis. Having programmatic understanding of available properties in Remote Configuration and their types helps this process and reduces configuration errors. It’s possible to define values for properties belonging to different systems in a single experiment. For example, if Android and iOS are implemented differently, we still can run a single experiment on both platforms.
Summary
We have spent the last two years rebuilding our experimentation capabilities at Spotify. The new platform is a step change in ease of use and capabilities, but we still feel it’s early for experimentation at Spotify.
We are constantly evolving our Experimentation Platform and practices. If you would like to know more, or if you’re interested in joining the team and contribute to our journey, do not hesitate to reach out.
Johan Rydberg, Experimentation Lead
SHARE THIS ARTICLE


