Introducing XCMetrics: Our All-in-One Tool for Tracking Xcode Build Metrics
TL;DR We just open sourced XCMetrics — a tool for Apple’s developer software, Xcode, that lets you collect, display, and track the valuable metrics hiding inside your team’s Xcode build logs. Are your build times improving or regressing? Which version of Xcode is slowest? Which hardware setup is fastest? XCMetrics makes it easy to find out all this and more. Made for iOS engineers, by iOS engineers, the tool is written completely in Swift, so it’s easy to customize. Use it to track the metrics you want — and get insights that can help improve both developer experience and productivity.
The problem: Where do you get good Xcode build data?
You’ve read before on this blog about how our infrastructure teams are always finding new and innovative ways to make data-driven decisions. But what if you don’t have access to good data in the first place? This is especially challenging for iOS engineers given that most of that platform’s tools are closed source, making it especially tricky to customize them to your needs.
For example, when we first introduced Swift to our music app, a requirement that we set for ourselves was not to worsen the developer experience. One metric for that is build time: is adopting Swift slowing our Xcode build times down or speeding them up? And how do we accurately measure that (without using a stopwatch every time we hit run)?
Our first solution: Parse the data from Xcode’s log files
Whenever you run a build in Xcode, whether it’s a test build or a continuous integration build in production, xcodebuild produces a log file called xcactivitylog. Many developers don’t know that this file exists or that it’s useful for inspecting warnings, errors, and other data from past builds, like build times. So, over a year ago we developed and released an open source tool called XCLogParser — which parses those xcactivitylog files and makes all that build data more accessible to developers.
XCLogParser was created for a simple purpose: unearth the data buried in Xcode’s build logs and make it more human readable. But one piece of feedback we received from various teams after open sourcing XCLogParser is that it still requires substantial time to build the infrastructure for continuously collecting those build logs and maintaining them over time.
It was time for us to build a more full-featured tool — one that could integrate with a production environment composed of distributed teams, and provide better insights over time. A collector and a tracker, not just a parser. And that’s how XCMetrics was born.
A complete solution: Collect, parse, store, track, repeat
We’ve been developing and testing XCMetrics over the last year, building a whole suite of tools in order to create a complete solution for tracking Xcode build metrics. Since introducing this system at Spotify, the tools have been used to collect over one million builds and billions of compilation steps — producing over 10TB of data.
With this amount of data, we’ve been able to answer complex questions for our developer teams, such as:
Which function takes the longest to typecheck in our project every day?
Which pull requests introduce a specific warning or compilation failure?
How should we configure our engineers’ machines in order to maximize their productivity (hardware specs, installed software, etc.)?
We’ve used these insights to improve the everyday experience and productivity of our developers, and we think other organizations will find these kinds of insights valuable, as well. So we are happy to open source XCMetrics with the world — we’re especially excited to see and learn from the insights other teams uncover.
Architectural overview: Designed for scale and customization
XCMetrics is an all-in-one tool that tracks Xcode build metrics for teams of all sizes. We built it with a flexible and extensible architecture in order to fit as many requirements as possible into its plugin system, allowing for customization of the information collected in every build.
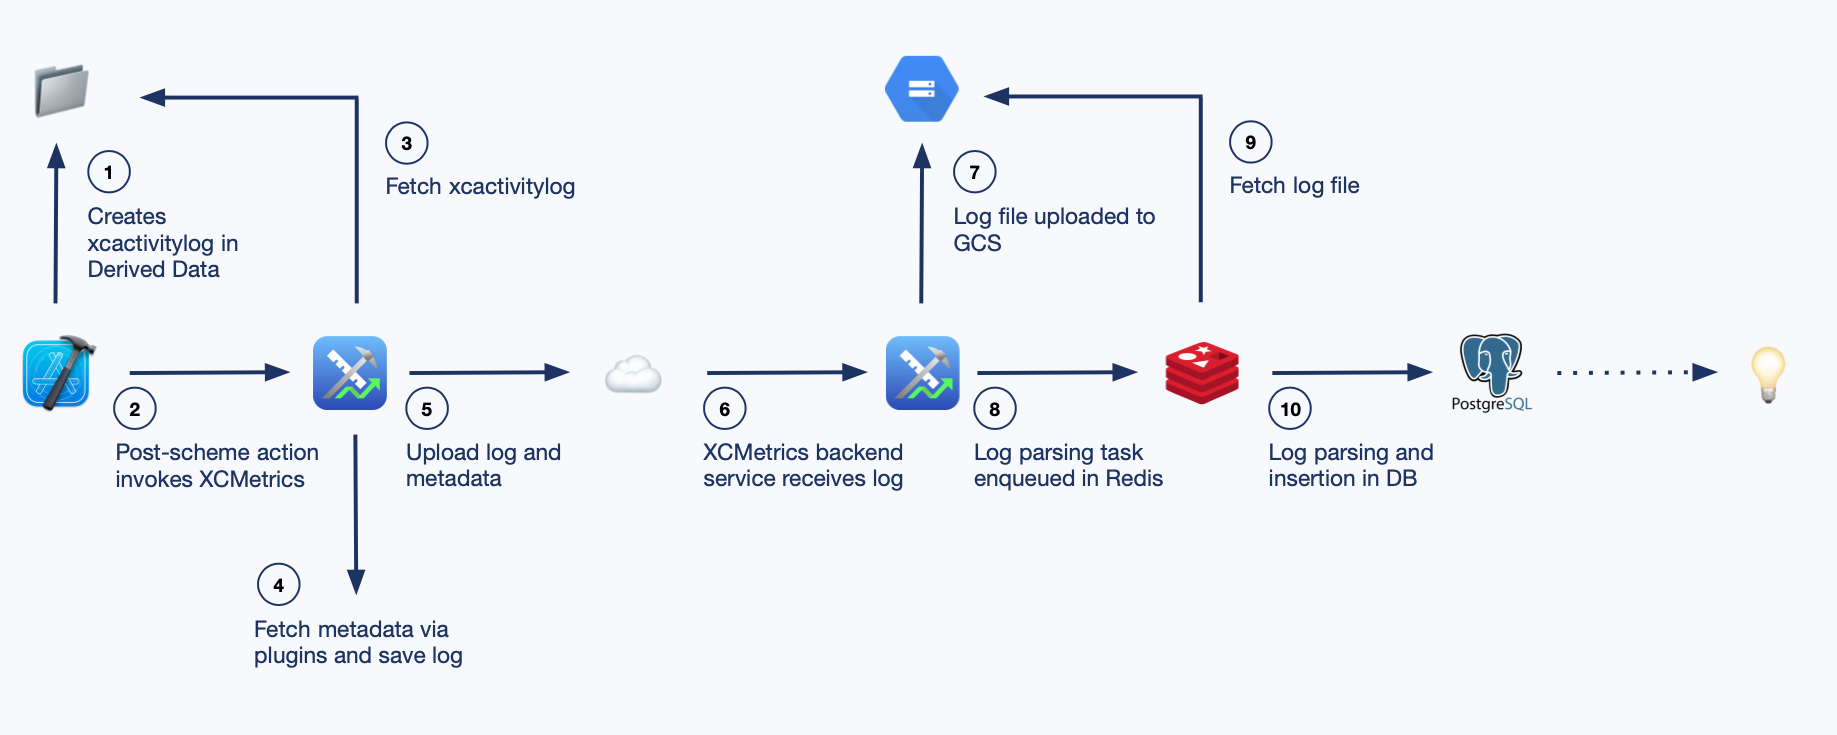
XCMetrics is made up of the following components:
A Swift CLI tool that should be invoked in a post-scheme action after every build completes, whose task is to cache and upload build metrics.
A backend service written in Swift receives the log and attaches metadata via a multipart request. The data can be parsed and saved synchronously or asynchronously.
If the configuration specifies parsing logs asynchronously, they are enqueued for processing in a Redis instance.
A PostgreSQL database — once the log is parsed, the data for each build is inserted into the database, partitioned by day, for easy retrieval and historical analysis.
Getting started: Which metrics do you want to track?
We did our best to make XCMetrics as generic and customizable as possible. The only decisions you have to make are where the backend service should be deployed — and, more interestingly, what type of data you would like to collect.
Standard metrics
XCMetrics is distributed as an executable from our GitHub releases page. You can follow the Getting Started guide to learn how to get XCMetrics on your developer’s machine and execute it in a post-action scheme. Once that’s done, the default set of build metrics will be collected and uploaded to your service. You can check out the default set of collected metrics here.
Custom metrics
If you would like to collect even more metrics, you can wrap the XCMetrics Swift Package in your own package in order to invoke it manually. By doing so, you’ll be able to provide even more metrics to be attached to every build. Some examples are:
Anonymized version control information to correlate build times with dirty checkout state
Thermal throttling of the machine that could affect build times
Project configuration information that could affect build metrics
This is the minimal example of a XCMetrics plugin that collects the thermal throttling state of the machine and attaches it to each build.
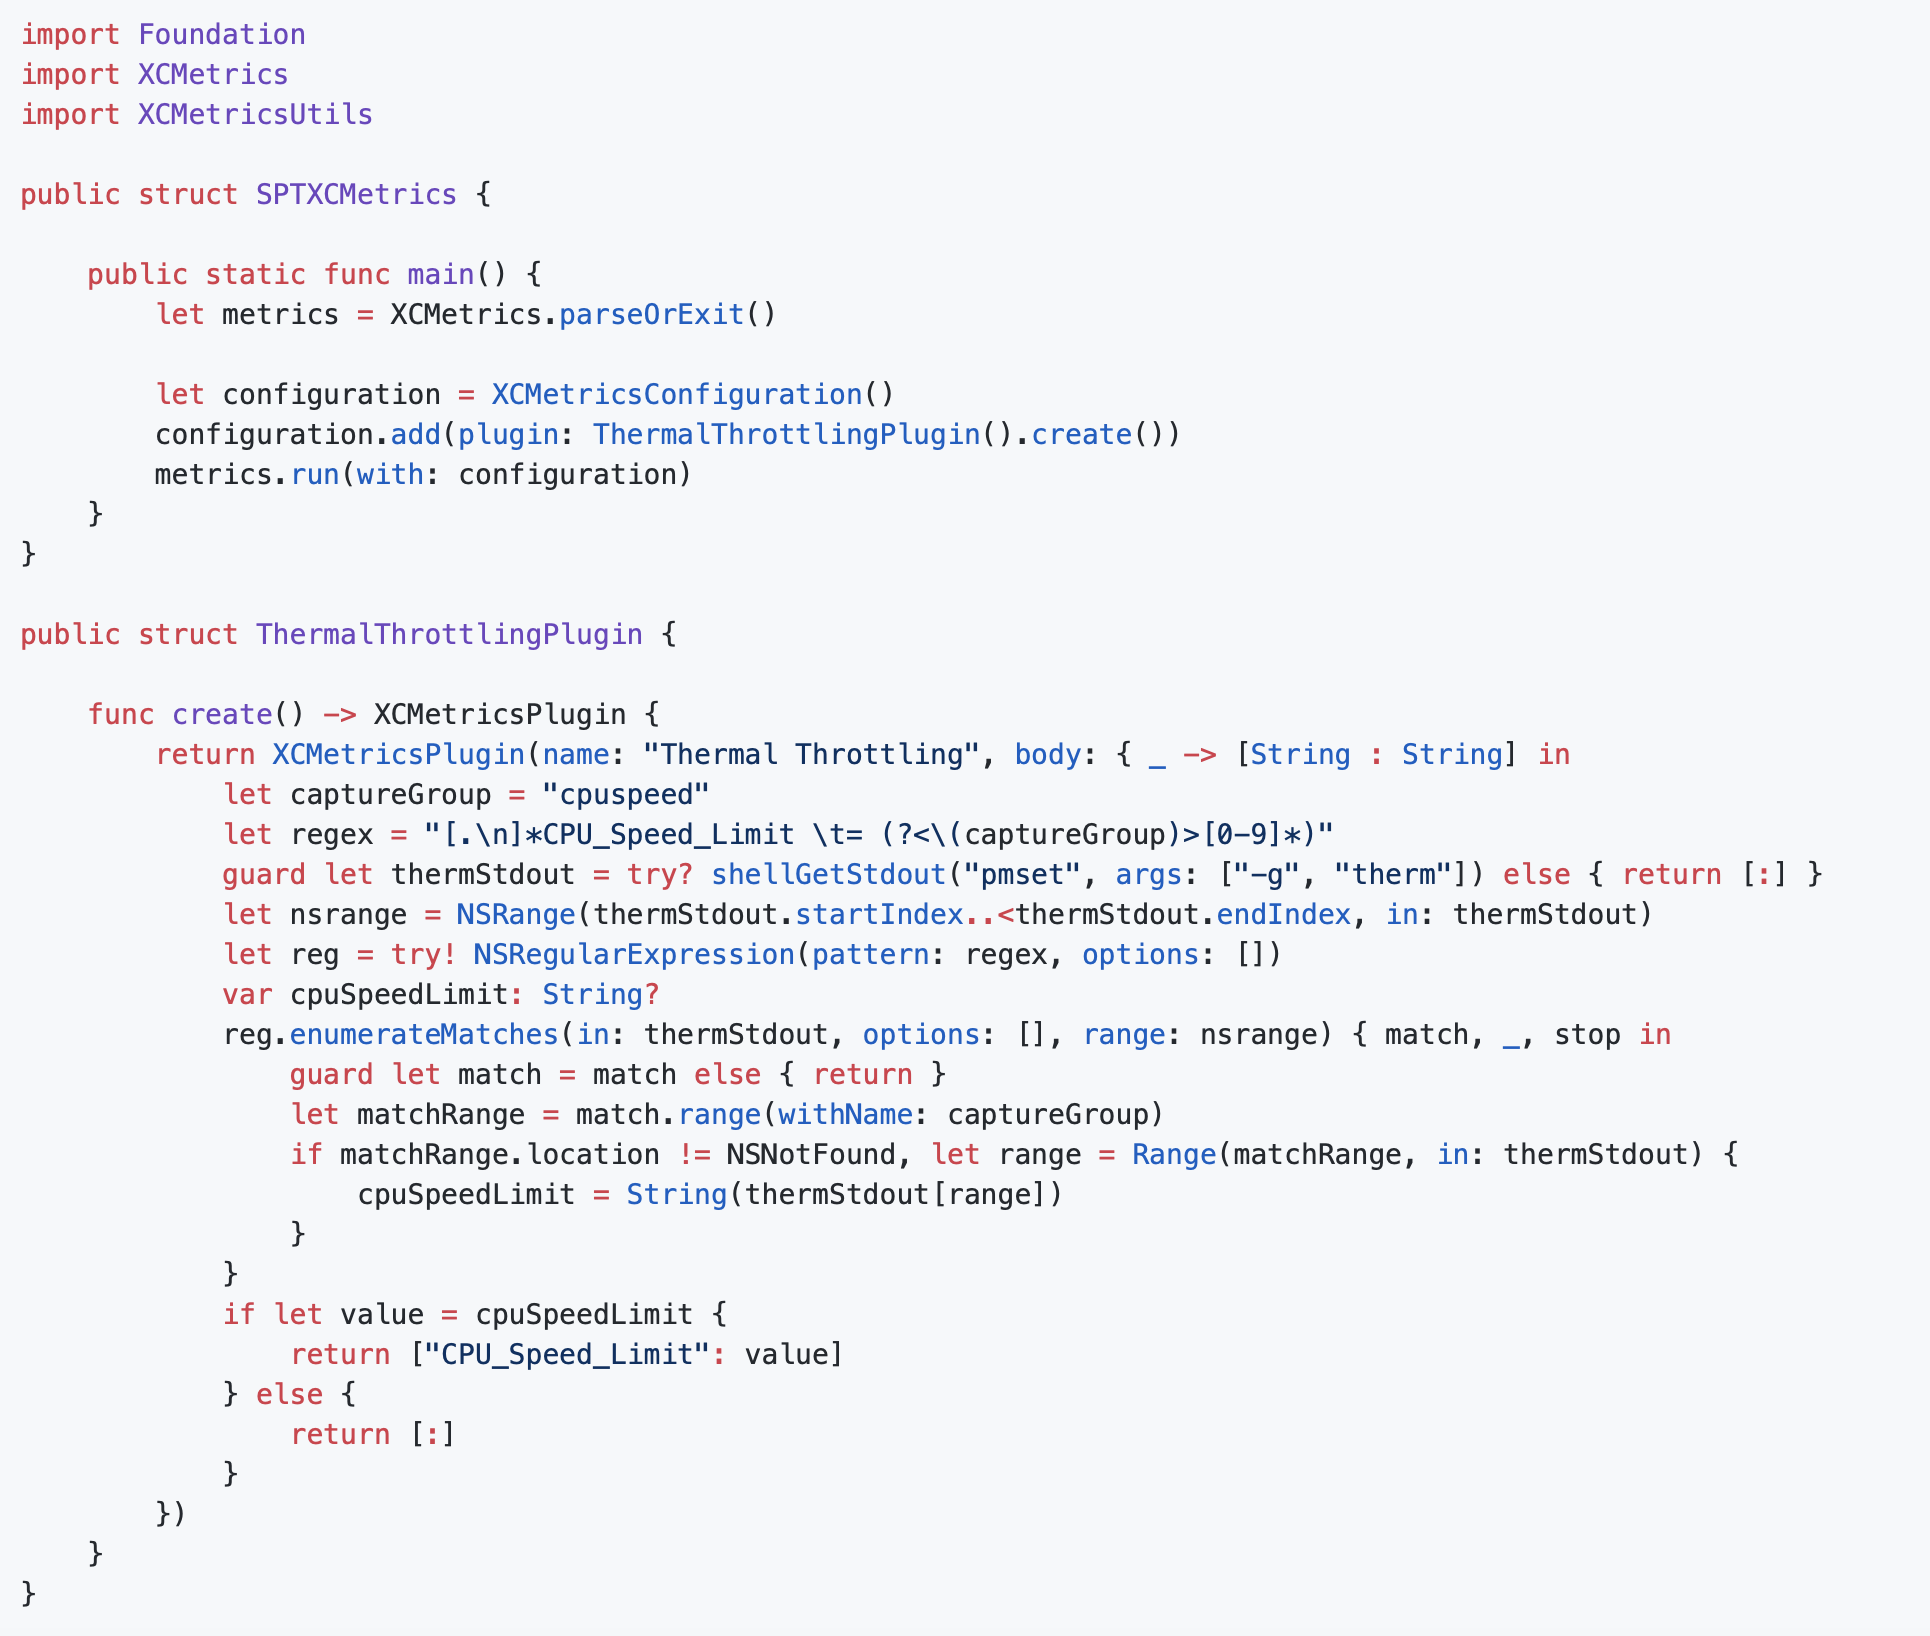
The main method forwards the arguments parsing to XCMetrics. You proceed to create a XCMetricsConfiguration and add XCMetricsPlugin to it. Each plugin takes a dictionary of the environment variables passed to the post-action scheme environment and returns a dictionary of the metrics to be collected. You would then distribute your own custom version of XCMetrics and execute it with the same arguments to upload the logs with the new metrics attached.
Service deployment
We provide a Docker image that has everything needed to deploy the XCMetrics backend in any infrastructure. We also support a one-click deployment to Google Cloud via Google Cloud Run. Our documentation also contains examples on how to deploy to Kubernetes, if you fancy that.
Needless to say, you don’t need a complex DevOps team to deploy and run XCMetrics. It’s made by iOS engineers, for iOS engineers, so simplicity is at its heart.
Using XCMetrics at Spotify
XCMetrics has been in use in production at Spotify for over one year, and it has allowed us to make more informed decisions in regards to our project structure and investments. We have data pipelines and dashboards that are used every day to monitor the state of our codebase and tools.
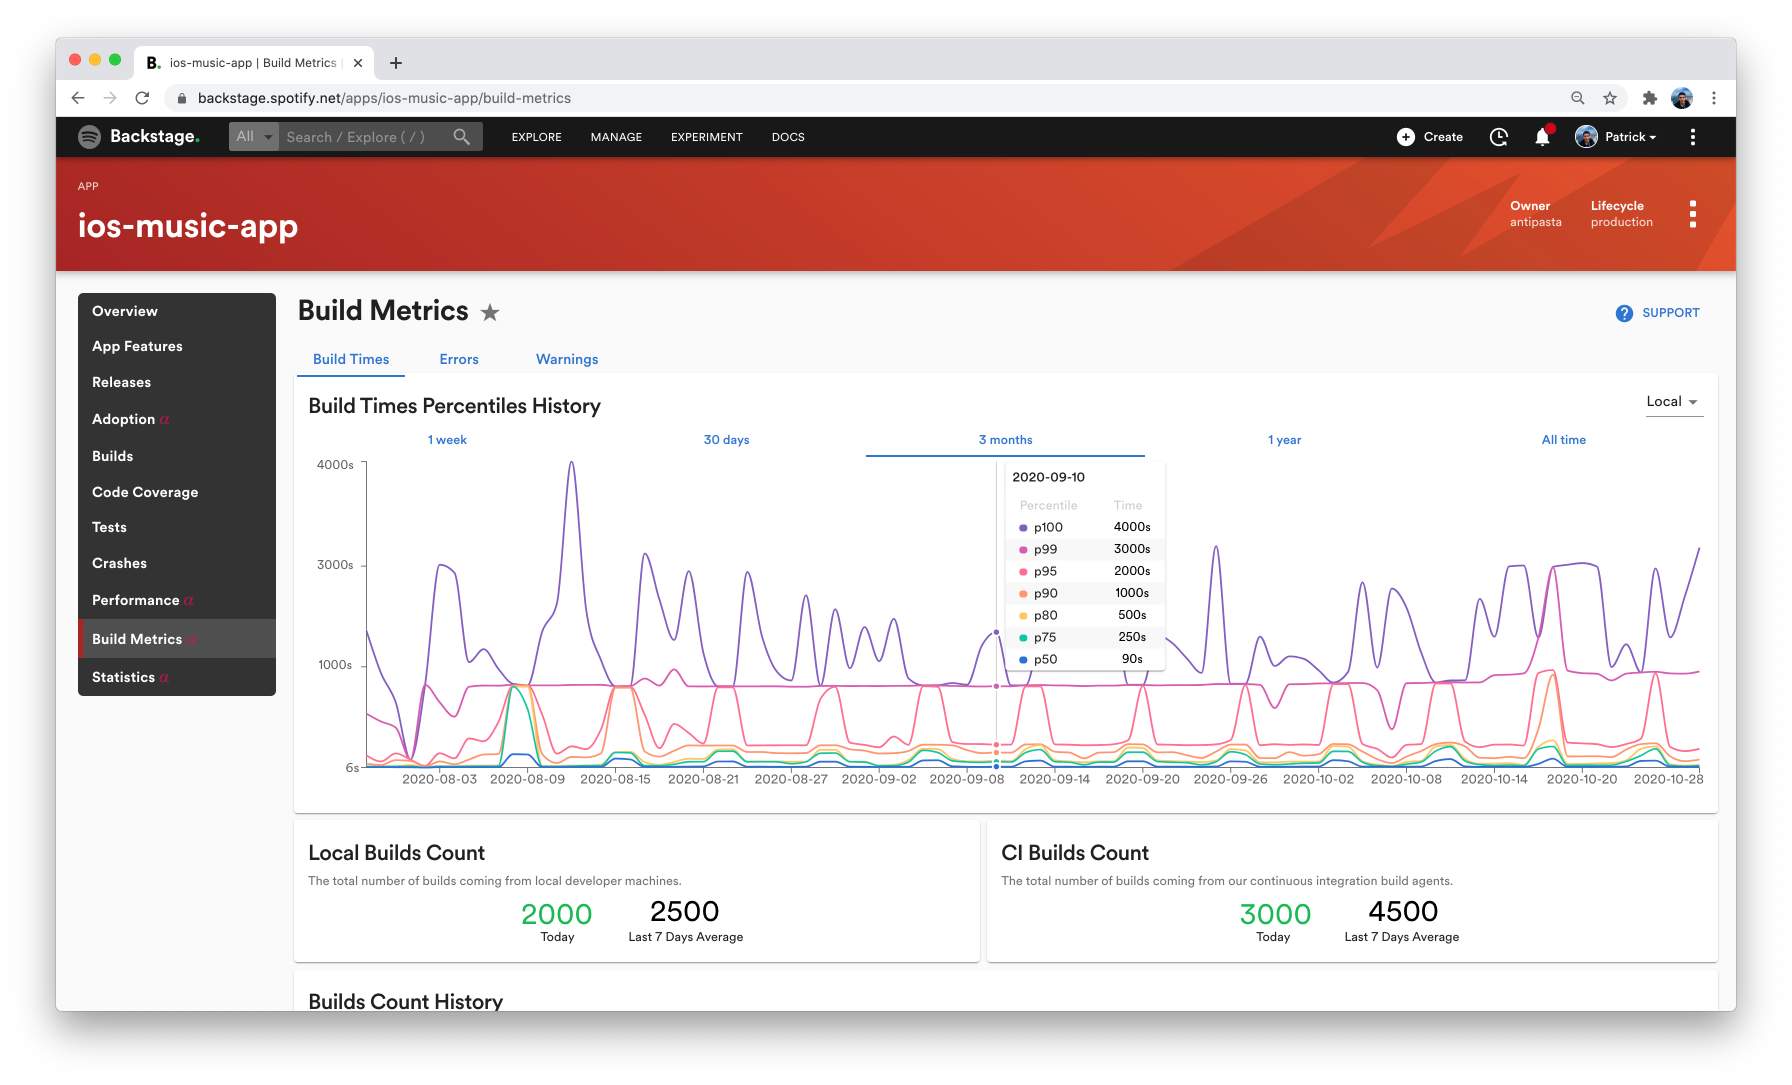
Figures above are for illustrative purposes only.
We hope XCMetrics will inspire and help other teams keep track of their build metrics and improve their developer experience.
You can learn more and watch a demo at XCMetrics.io. We are happy to receive bug fixes and improvements on GitHub. And make sure to check out our contribution guide, which explains more advanced concepts of the project.
Xcode is a trademark of Apple Inc., registered in the U.S. and other countries.
SHARE THIS ARTICLE