Failing Forward — How We Grow from Incidents
This past year, a few of us who focus on the reliability of Spotify for Artists (S4A) spent some time taking a look at the collection of incidents directly affecting S4A in 2021. We made some hypotheses, and then went to work analyzing each one to build a set of quantitative and qualitative metrics. We learned a few things, and we hope those insights will help you as well.
We trade productivity now for productivity later
Every time something doesn’t go according to plan, there are costs, and benefits. Our minds typically jump to the kinds of negative costs we incur when users are impacted, but there is another cost — productivity.
We found that most incidents have a moderate to high productivity impact. This means that when an incident happens, 55% of the time at least one responder spends the better part of a day addressing the problem. Quite often, 23% of the time in fact, the blast radius for productivity impact is even bigger.
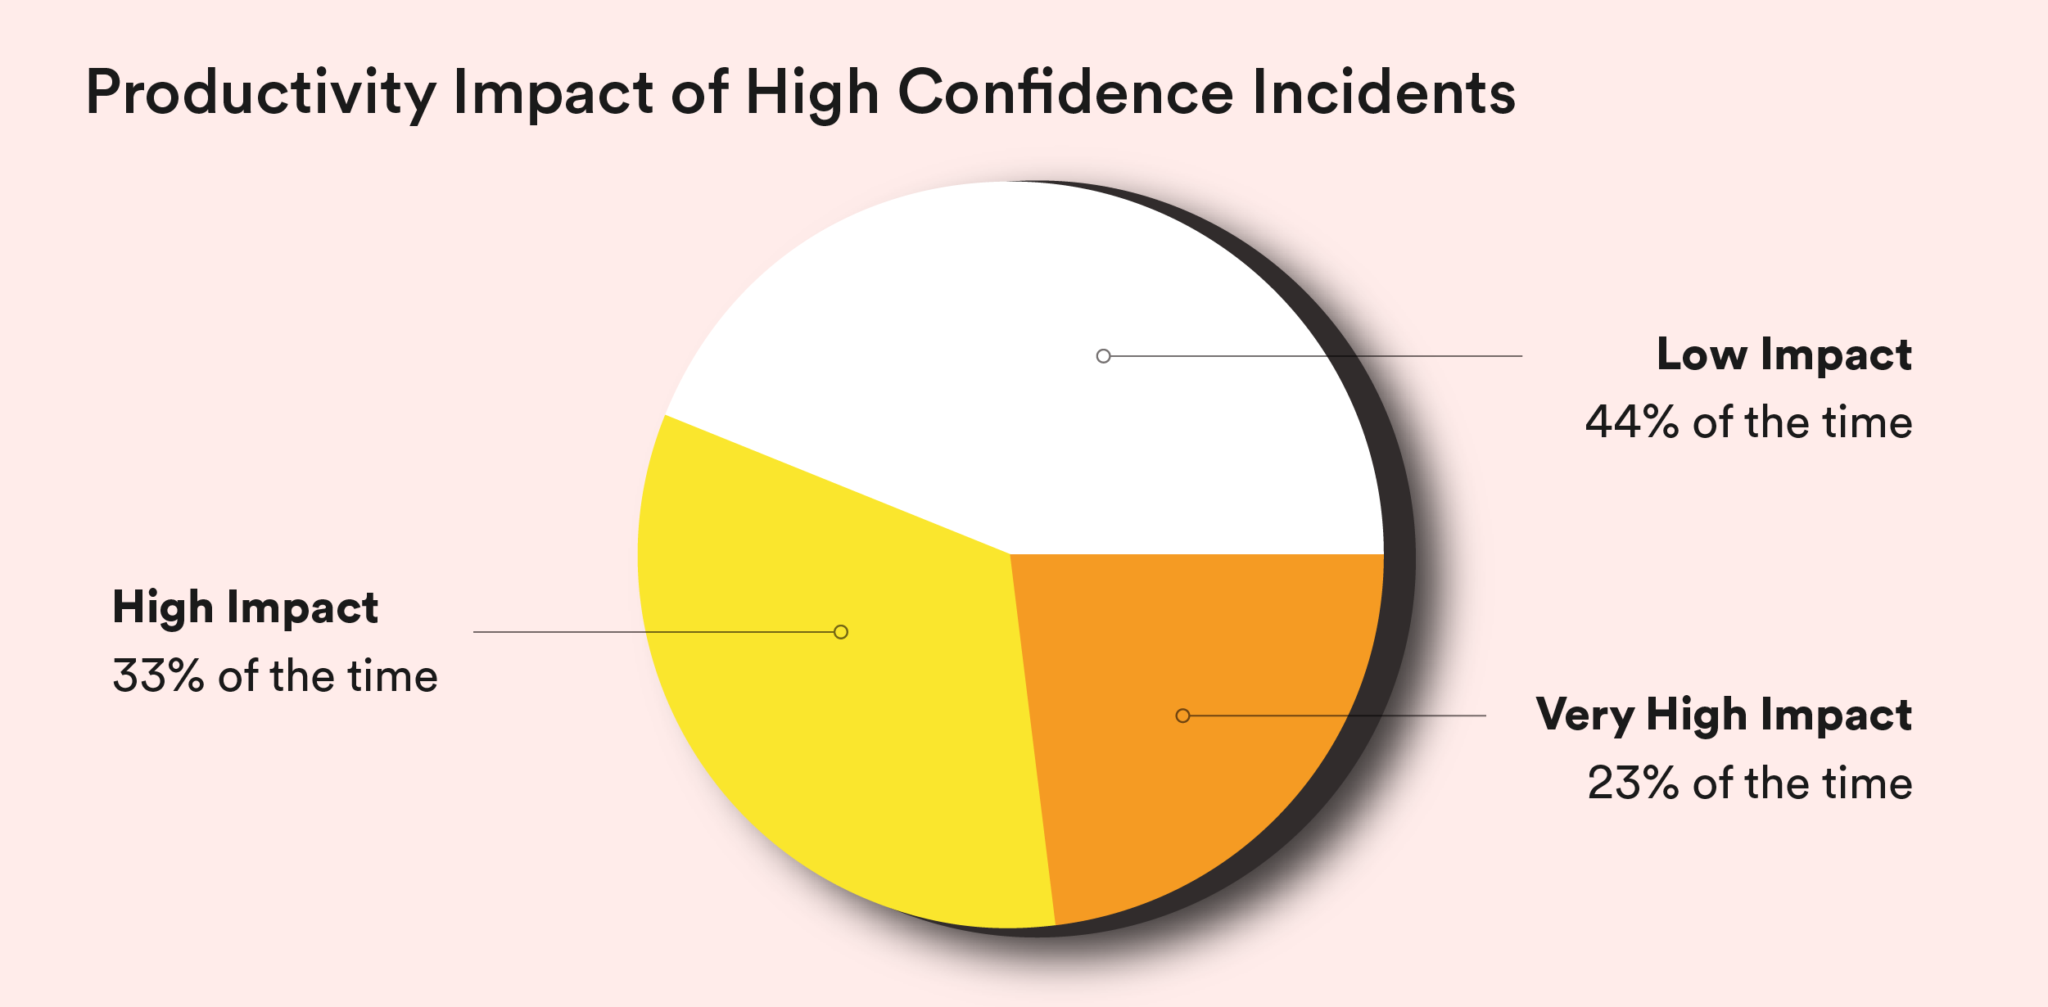
Now, you might say, “Oh wow, you waste a lot of time fixing stuff!” But, as mentioned earlier, this cost has a benefit, when properly managed. When we take the time to run an incident review (we used to call this a postmortem), we have an opportunity to investigate and internalize how and where the system broke down. While we can read code and docs and hypothesize where the issue stemmed from, analyzing a failure is an opportunity to correct our understanding and bring it closer to reality. Leveling up our engineers in this way leads to better outcomes. This is how we buy productivity later, by sacrificing some of it today.
Most incidents are (technically) preventable
For every incident, we looked for signs that the event could have been prevented. We built a rubric based on past evaluations of incidents, with a scale going from 1, which is “almost impossible to prevent”, up to 5, which is “we saw this one coming and let it happen”. Thankfully, we didn’t have any 5s!


As seen above in our scoring rubric, 2 and 1 are generally unclear or outside our control and thus wouldn’t really count as highly preventable. However, starting at 3, these are localized failures that can be prevented and/or mitigated by taking known and well-understood preventative actions.
This isn’t to say that prevention is free or easy. But, by defining a service level objective (SLO), we are setting an error budget — if we can stay within our error budget without a preventative measure, we should. That just means we can spend our time working on improving other aspects of the user experience and, ultimately, focusing on our core mission.
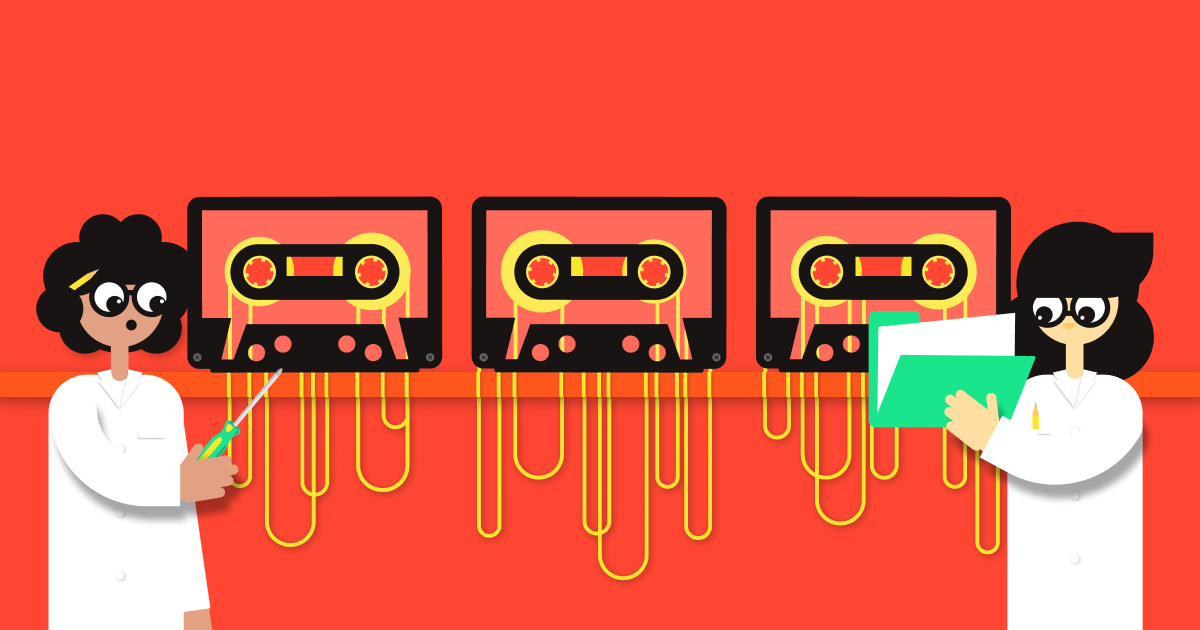
Humans don’t like paperwork
For the last few years, the DevOps Research and Assessment, or DORA, has produced an annual “State of DevOps” report. They survey thousands of industry professionals and determine what makes engineering efforts tick.
Two of the “golden metrics” they have identified are “Mean Time To Recover” and “Change Fail Rate”. These two metrics can mean different things to different orgs. It can be tempting to see them as the end of a conversation about reliability, but they are more like a map, helping us understand where we are, and where we want to go.
For our 2021 incident study, we carefully looked at every S4A-related incident timeline as recorded, and then the supporting evidence in order to establish a clear picture of each incident’s Time to Recover (TTR).
We found that about 50% of the time, no attempt was made to record a start and end time. And when people did make an attempt at recording their time to recover, about 81% of the time we had to adjust the time entered by more than 5 minutes to reflect the true number.
This isn’t a failing of operators, but a failing of the system. We asked folks to fill out some paperwork, but we didn’t pair it with an incentive model, and predictably, they opted to spend their time on things with greater incentives.
Having synthetic tests reduces time to recover
After this work involving timelines, we got some signals on time to recover. One such signal was that TTR was all over the place and genuinely hard to correlate with any single aspect of our systems.
However, we got a hit. One of the more exciting things we learned through our incident study was that synthetic testing works. We spent a fair amount of time grading whether or not a synthetic test would have plausibly detected outages, and then looked at the TTR for those that were in fact detected by synthetic tests, versus those that were not because they were not covered by a synthetic test.
The results were even more striking than we thought. We found that incidents involving coverable features that did have a synthetic test saw a recovery time that was generally 10 times faster. No really, read it again!
This may seem obvious, but we never want to discount the power of data to drive decisions. This isn’t just a curiosity. We’ve adjusted our priorities to put a greater emphasis on synthetic testing, as we think it’s pretty important to get things back up and running as quickly as possible.
So remember…
If you take something away from this post, I hope it’s an appreciation for the power of celebrating incidents as learning opportunities. Whether studying incidents as a collection, the way we did, or taking time to learn from them in your own context, there’s simply no replacement for this real-world source of data. It may seem tedious to interrupt your flow to investigate the failure. However, we think it’s vital to do so if you want to grow and sustain your service’s uptime.
If this tale has captured your imagination, and you are interested in working on a data-driven, reliability-focused team, come join us!
SHARE THIS ARTICLE