How We Built Infrastructure to Run User Forecasts at Spotify

TL;DR With Spotify’s rapid global expansion to more than 180 countries, it’s critical that the infrastructure of user forecasts catch up to business needs. As the business evolves, we need an infrastructure in place that can satisfy the varying needs of stakeholders across the company. To enable fast iterations and facilitate model training, we built a system that allows user forecasts to run both on demand and automatically every week, with the heavy hyperparameter tuning part running on the weekend. The system creates visualizations and automated insights to surface information, and provides easy-to-use tools for manual interventions for both data scientists and business stakeholders.
Background
At Spotify, many company key metrics are forecasted quarterly, weekly, or daily to help the business monitor performance, make business decisions, and improve our product offerings. Some of these metrics can be difficult to forecast given their volatile characteristics and pose interesting time series forecasting problems. User forecasts are one such metric, and are especially important to get as accurate as possible given they inform business decision-making and are one of the most used business health indicators.
In Q1 of 2020, we started the process of upgrading our infrastructure with the goal of having automated, high-quality market-level forecasts that could run weekly and on demand. By Q4 2020, the fully finished models were implemented with advanced hyperparameter tuning, allowing for faster iterations and improved quality control — processes that typically take several months to run on a single machine were now tuning within a few hours.
To ensure the system was error free, we separated core logic from runtime adjustments and experiments, and built integration tests and visualizations to help spot anomalies from a business perspective.
Infrastructure
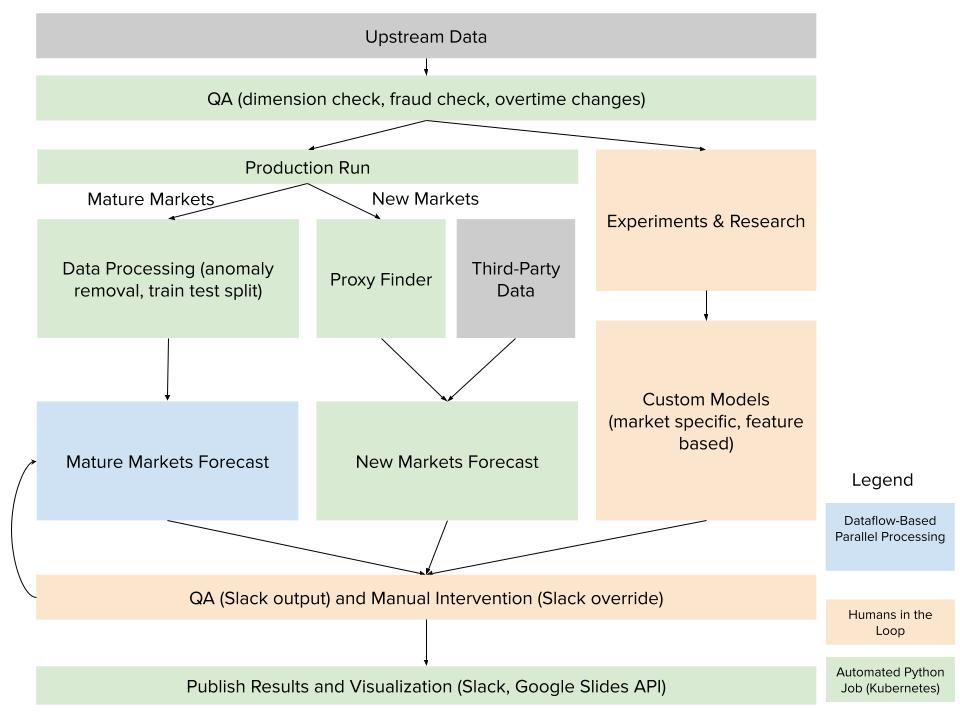
Figure 1: An overview of the entire system for user forecasts .
At a high level, after running QA on input data, the pipeline breaks into three workstreams: Mature Markets, New Markets, and Custom Models.
Mature markets
Mature markets have a robust history and are able to run time series models, allowing us to learn patterns from the history including trend changes, seasonalities, holiday impact, etc. The first step in the mature-market workstream is data processing. We remove one time disruptions that bias the forecast, so the models do not propagate the pattern into the future. After that, model training and inference begins.
New markets
New markets are newly launched, or soon-to-be launched, markets, and therefore have a limited set of data that data scientists can work with. For these markets, we developed an in-house, proxy-based model. External data like macroeconomics and music-related data are used to train clustering models to learn “proxy” markets among the launched markets. We then use internal data to learn from the launch and growth patterns from their proxies, i.e., look-alikes. These are classic “cold start” forecasting problems, and can be the most challenging to solve for high accuracy. However, we have seen that the proxy-based models achieved high reliability and consistency in forecast user growth after entry into new markets.
Custom models
Many cases under this worksteam are categorized as custom or “specialty” markets. They tend to be more nuanced, requiring human involvement for: 1) testing new research models; 2) producing accurate forecasts where business input is required; and 3) reviewing model results. For example, a market may be heavily campaign driven and require business input to generate accurate forecasts.
Tooling
Dataflow (Google-managed Apache Beam) is used when parallelization is needed to process large amounts of data or model runs. Smaller tasks are automated using dockerized Python jobs run on Kubernetes.
A closer look: mature and new market forecast components
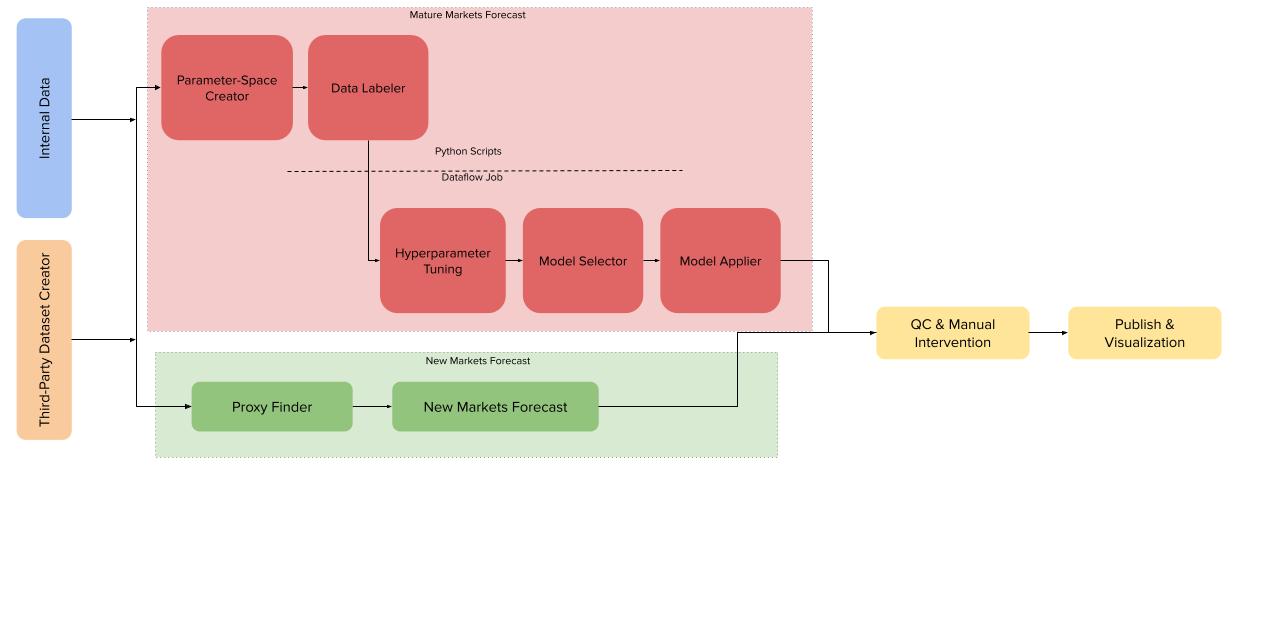
Figure 2: Mature and new market forecast components .
The most engineering-heavy part of the infrastructure is the mature markets forecast. Hyperparameter tuning is computationally heavy and needs dedicated data processing and labeling to prepare the data. Some of the key components of the mature markets forecast as seen in Figure 2 above include:
Parameter-Space Creator: Allows the user to set the hyperparameters to be evaluated via cross-validation (CV) and stores them in Google BigQuery.
Data Labeler: Labels time series data (train / test / validation) and reformats labeled data with hyperparameters for parallelization.
Hyperparameter Tuning: Runs models in parallel over all the different markets, cross-validation time splits, and hyperparameter combinations, and evaluates an error associated with each one. While this was originally done through Apache Beam API directly, the grid search was later abstracted away by an in-house package, which enables time series forecasts at scale.
Model Selector: Using the output from the hyperparameter tuning step, this component evaluates the weighted error of each model to determine the top X models and evaluates them against the final holdout set.
Model Applier: Runs the “best” selected model over the entire time period for each market to produce the forecast.
QC & Manual Intervention: Produces a series of checks on the final output that is shared with internal stakeholders through dedicated channels. We also made easy-to-use tools for business stakeholders to provide forward-looking input to contribute to more accurate results, e.g., a major marketing or sales campaign launching in a subsequent quarter that our models could not anticipate.
Publish & Visualization: Produces the automatic summary and insights. Multiple stakeholders find value from user forecasts, so increased internal visibility was a key priority while redesigning our infrastructure. Automated visualizations, made available through multiple channels, were made available for all of Spotify to use.
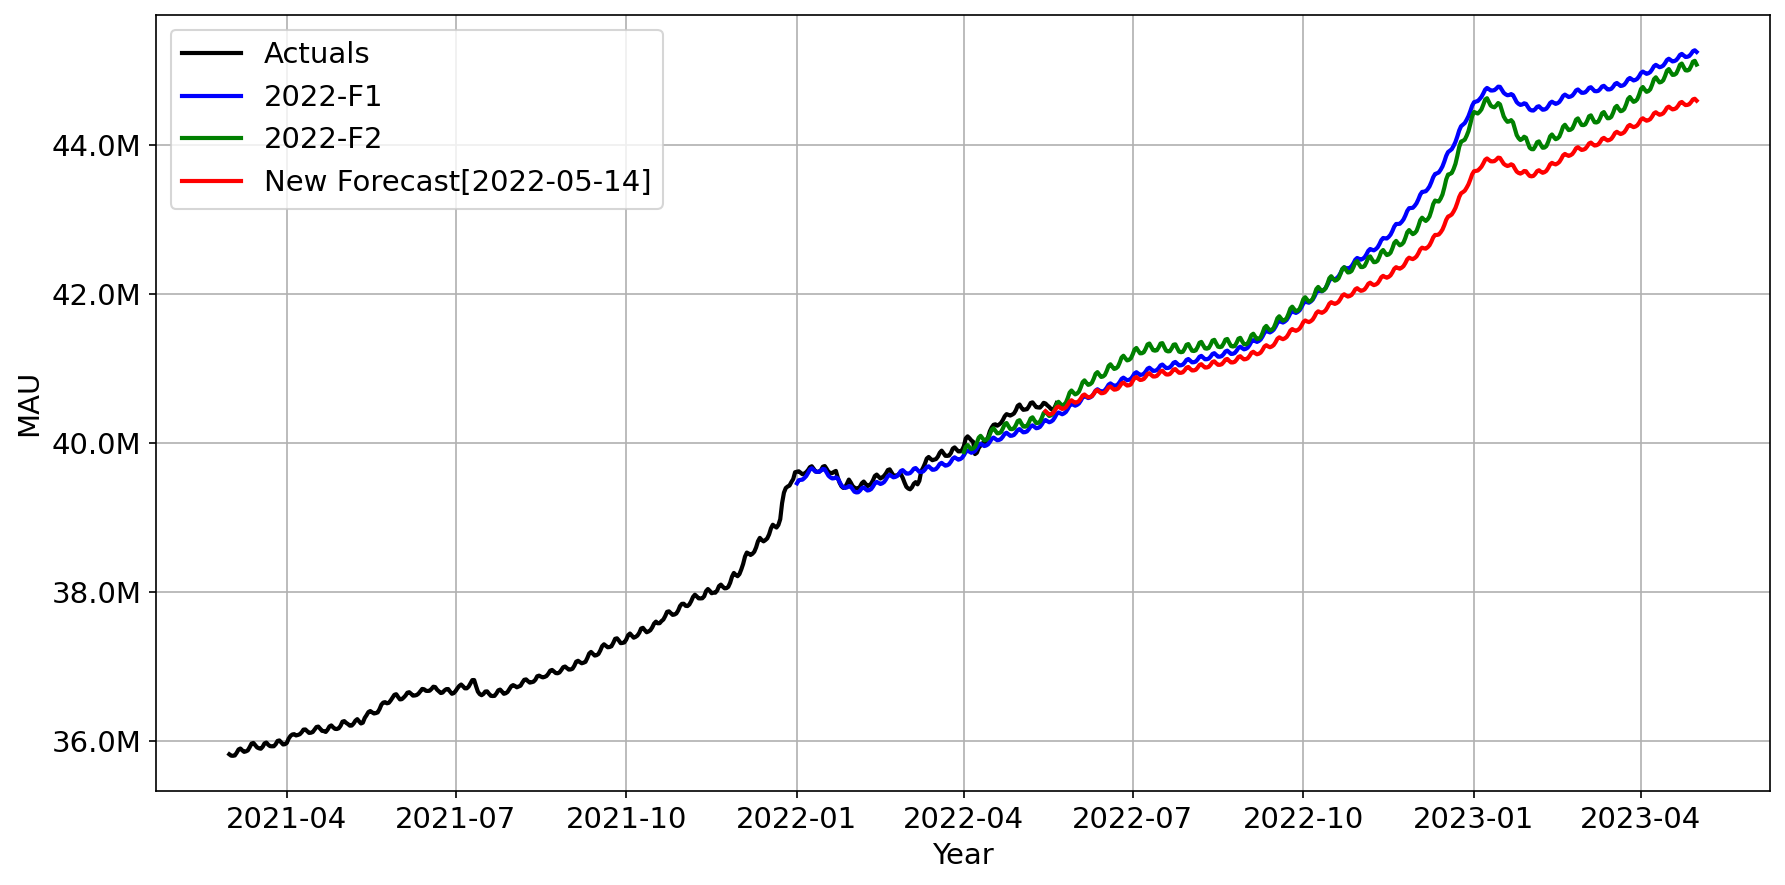
Figure 3: Forecast example. Figures presented are for illustrative purposes only.
In Figure 3 above, we plot the automatic new weekly forecast (red line) for a market in comparison with the previous two official forecasts (Q1 2022 and Q4 2021) to see where this market is trending.
Learnings
Balance quality control with fast iteration
There is a delicate balance between strict quality control and fast iteration, as strict quality control creates a lot of overhead for development. We decided to apply strict quality control on “core logic” (e.g., model implementation), which we deemed as extremely important to be bug free and logically correct, allowing for more flexibility in “peripheral logic” (e.g., chart/email creations). Core logics are packaged in a Python library, which is unit tested, strictly peer reviewed, and well documented for every new release, while developers can create extensions in the system or experiment with models that are not subject to such standards.
Scaling is magical, but not always the solution
We can be smart with our model choices and reduce computational burden with models well suited for the problem at hand. Research can also help narrow down the hyperparameter space and reduce brute-force searches through the part of space that has limited or no impact on the final outcome. Since there is heavy overhead involved with parallelization, we should only use it when necessary.
Simplicity
We have to strike a balance between simplicity and incremental improvement on model accuracy. Often decisions have to be made on whether to build additional logic into the core of the system, or to build it as an extension, or discard the change as costs outweigh benefits. Teams may have the tendency to lean toward building additional features at the cost of system health, but it’s important to always have the big picture in mind.
Acknowledgments
The forecasting infrastructure was built by Molly Zhu, Grant Webb, Michael Frings, Paul Levande, and Gabriel Araujo de Almeida, with contributions from Kelly Ho and Kathy Gao.
Passionate about financial engineering (FINE) at Spotify? We are hiring!
Look out for upcoming posts on methodologies, research, and work in development.
SHARE THIS ARTICLE


