Analyzing Volatile Memory on a Google Kubernetes Engine Node
TL:DR At Spotify, we run containerized workloads in production across our entire organization in five regions where our main production workloads are in Google Kubernetes Engine (GKE) on Google Cloud Platform (GCP). If we detect suspicious behavior in our workloads, we need to be able to quickly analyze it and determine if something malicious has happened. Today we leverage commercial solutions to monitor them, but we also do our own research to discover options and alternative methods.One such research project led to the discovery of a new method for conducting memory analysis on GKE by combining three open source tools, AVML, dwarf2json, and Volatility 3, the result being a snapshot of all the processes and memory activities on a GKE node.
This new method empowers us and other organizations to use an open source alternative if we do not have a commercial solution in place or if we want to compare our current monitoring to the open source one.
In this blog post, I’ll explain in detail how memory analysis works and how this new method can be used on any GKE node in production today.
Container workloads at Spotify
Spotify is a heavy user of GKE on GCP, and we run most of our production workloads today in GKE. We’re present in five GCP regions and run a few hundred thousand pods in production at the same time across more than 3,000 GKE namespaces.
In summary, it’s safe to say that we’re a big user of GKE and have a need to both scale our production workloads and also monitor what is happening in our production.
GKE foundations
Although Google has its own method for implementing Kubernetes in its cloud environment, being GKE, there are a few general terms to keep in mind:
Control Plane: The container orchestration layer that exposes the API and interfaces to define, deploy, and manage the lifecycle of containers.
Cluster: A set of worker machines, called nodes, that run containerized applications. Every cluster has at least one worker node.
Node: A node is a worker machine in Kubernetes.
Namespace: An abstraction used by Kubernetes to support isolation of groups of resources within a single cluster.
Pod: The smallest and simplest Kubernetes object. A Pod represents a set of running containers on your cluster.
Container: A lightweight and portable executable image that contains software and all of its dependencies.
Below, you can see a high-level architecture of a GKE cluster on GCP (Source: https://cloud.google.com/kubernetes-engine/docs/concepts/cluster-architecture).
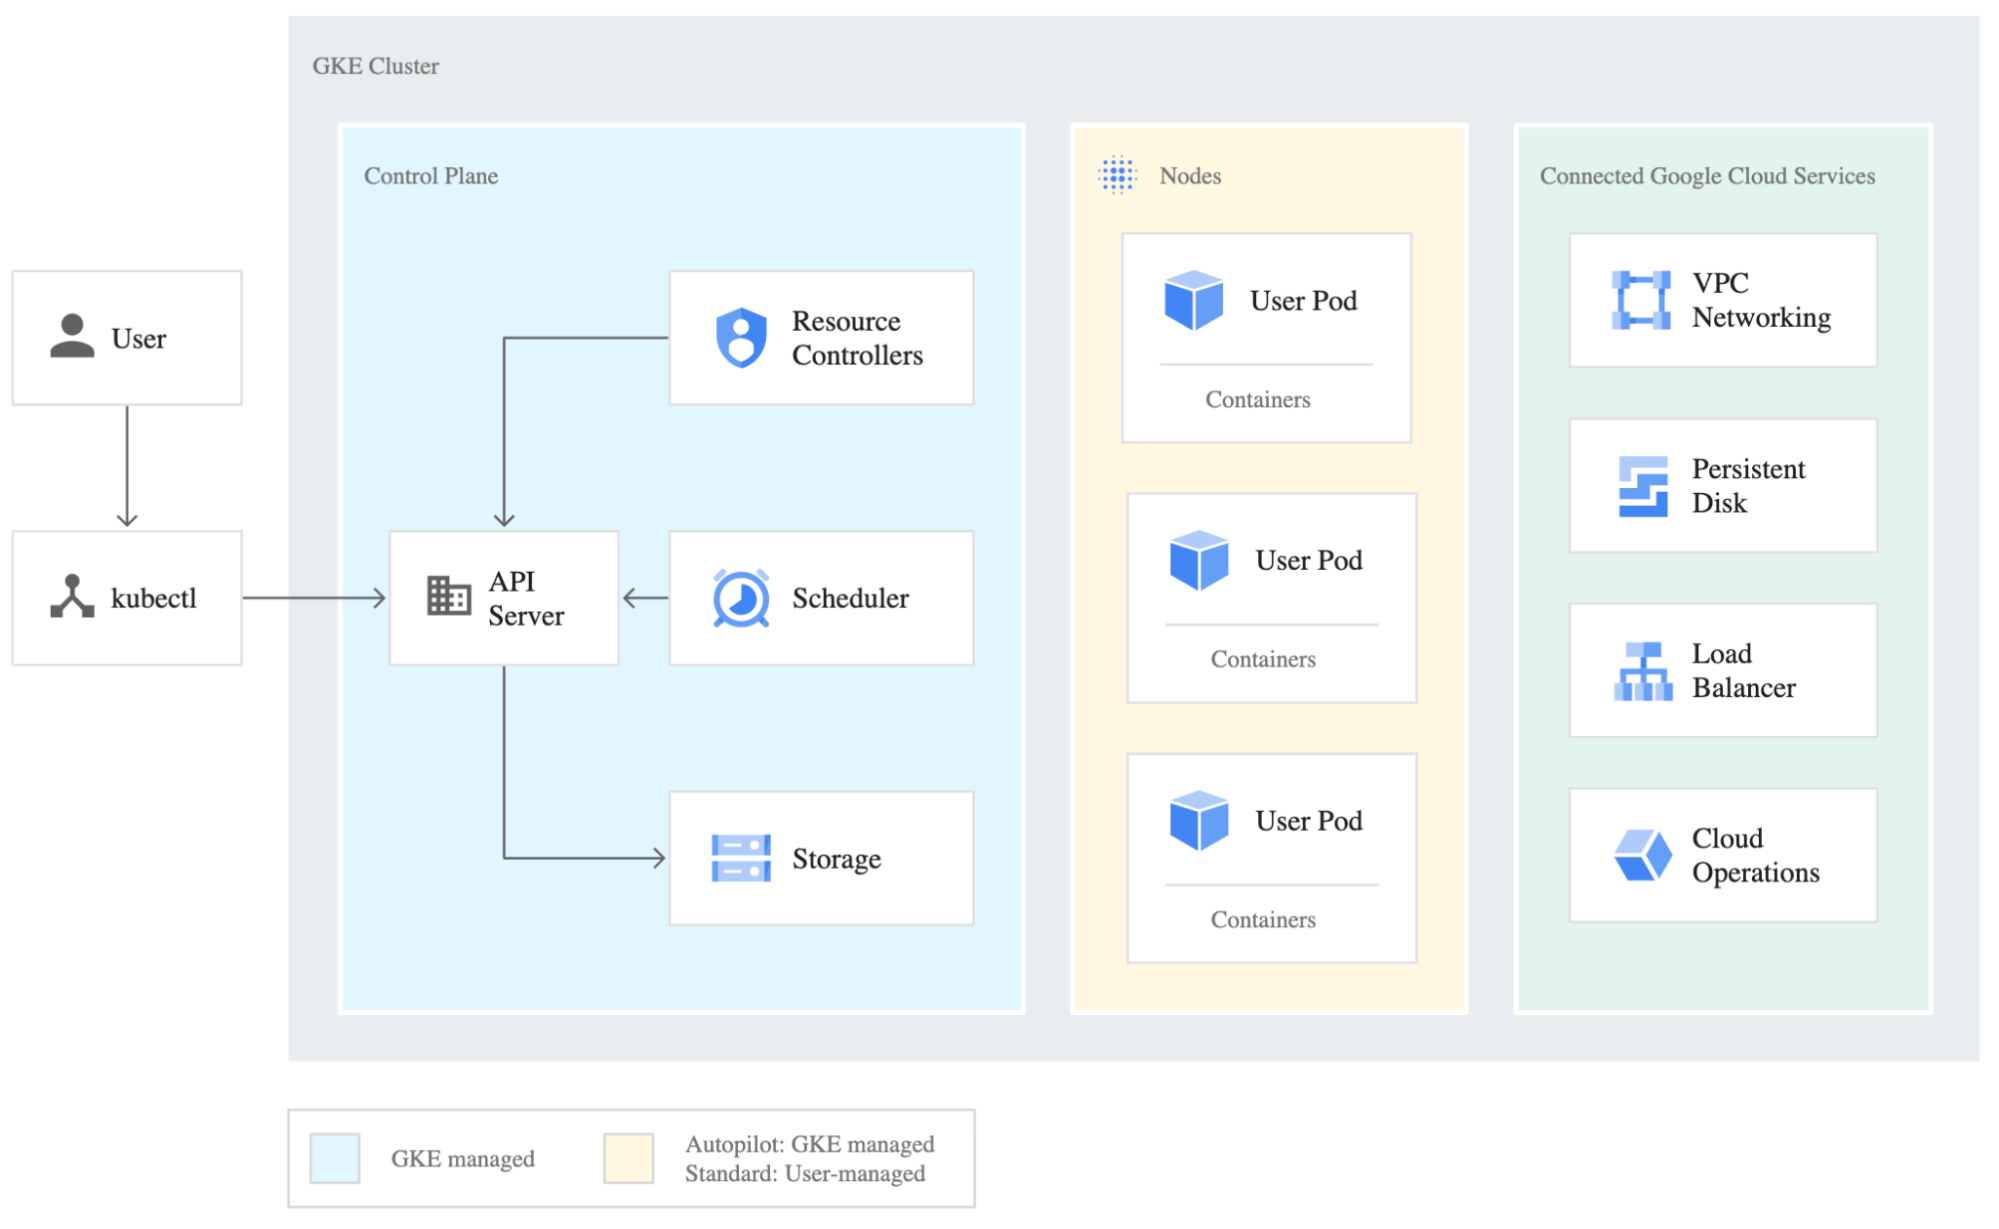
Figure 1: GKE-managed cluster overview.
What is a kernel?
The kernel is the main layer between the operating system (OS) of the GKE node and the underlying server resources. It helps with important tasks like process and memory management, file systems, device control, and networking. Below is an overview of the kernel layout:
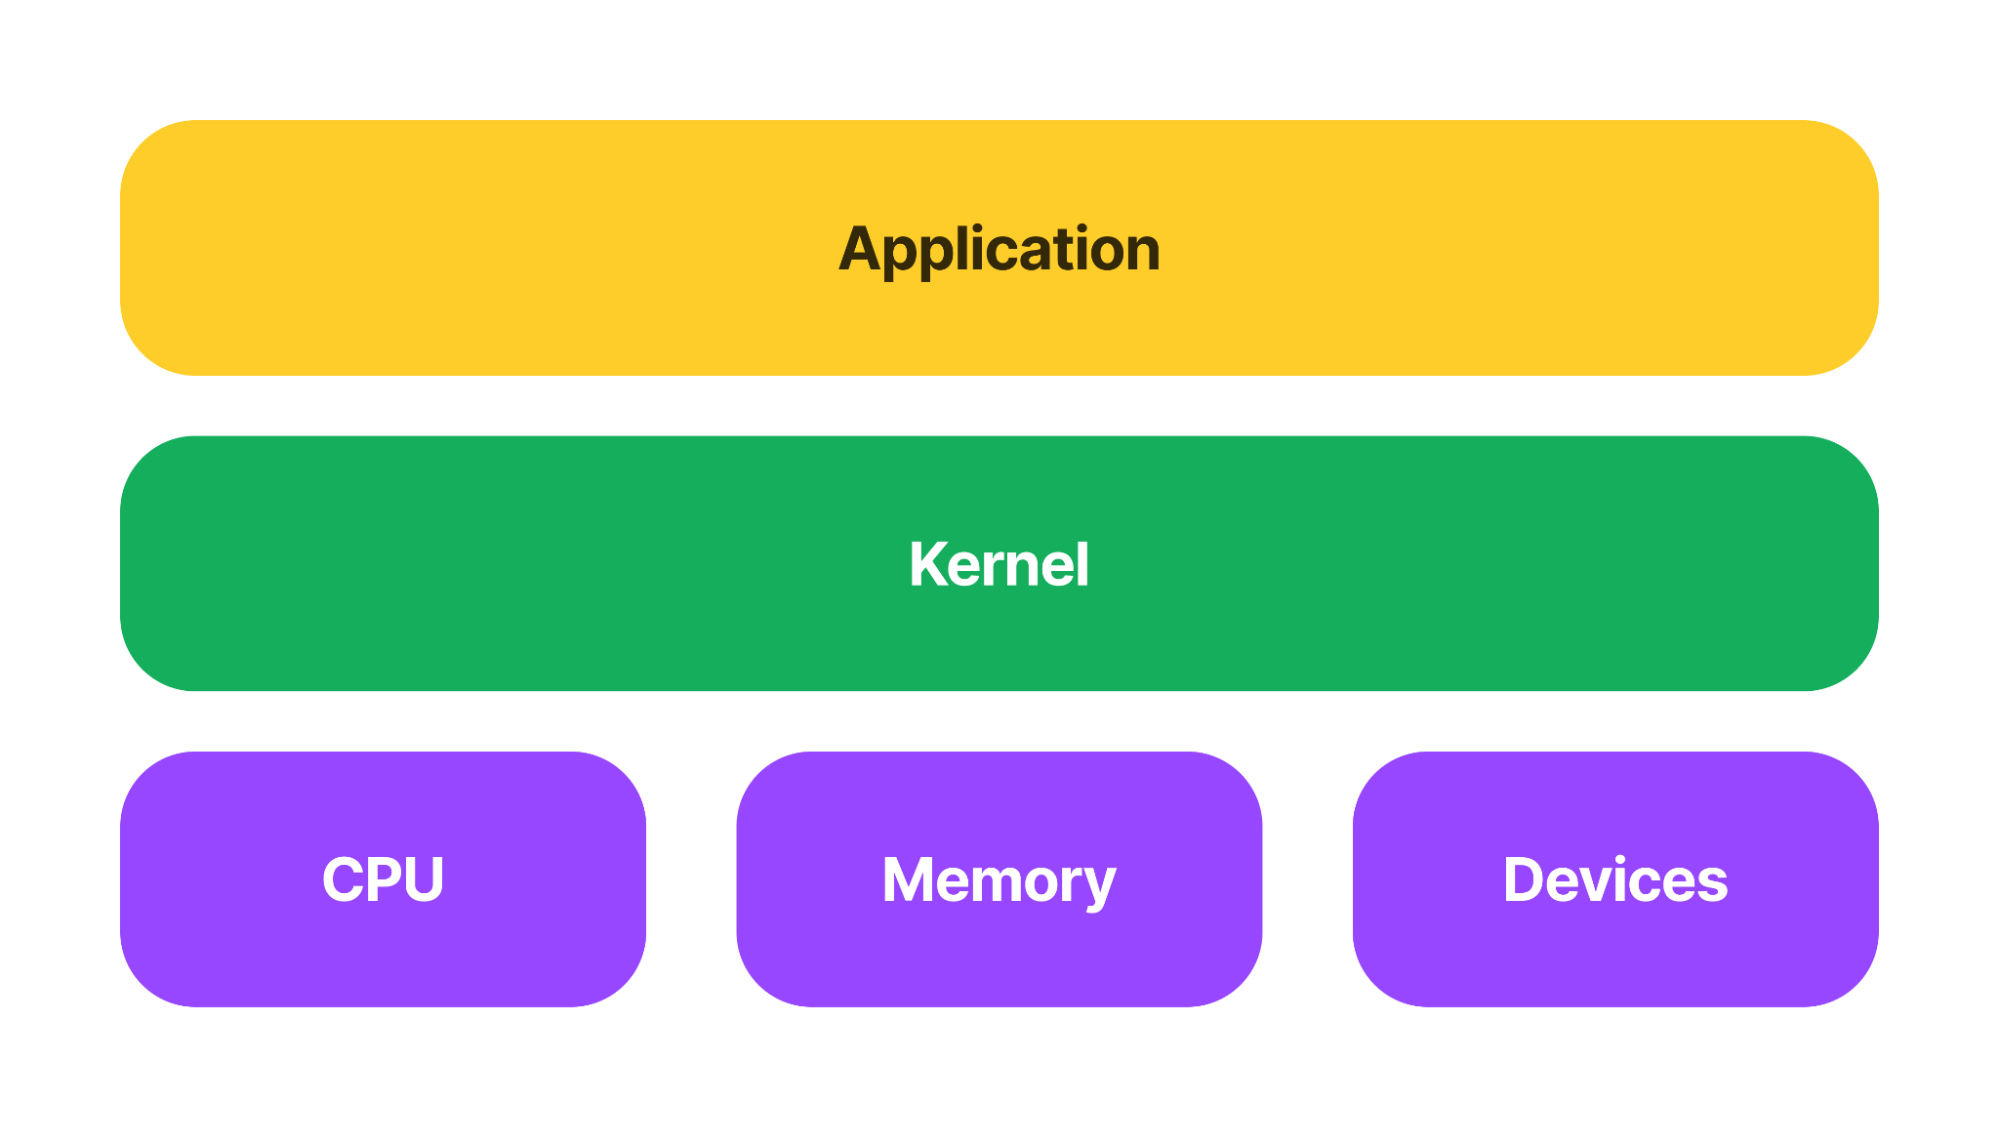
Figure 2: Application overview.
If we want to understand what is happening on a GKE node and what processes are running on it in memory — the kernel is the optimal place to find it. Many commercial solutions today leverage the extended Berkeley Packet Filter (eBPF) and its sandbox approach to access the kernel. This, however, requires that you buy a commercial solution that uses eBPF or you build your own solution on top of it. As my research showed, there is another approach we can take.
Memory analysis on a GKE node
So how do we access the kernel on a GKE node and analyze the memory? My research boiled it down to the following three steps:
Step 1: Create a kernel memory dump
Step 2: Build a symbol file of the kernel
Step 3: Analyze the kernel memory dump
In order to demonstrate the following steps, I created the below architecture using Terraform and a Python script that integrated with the GCP API.
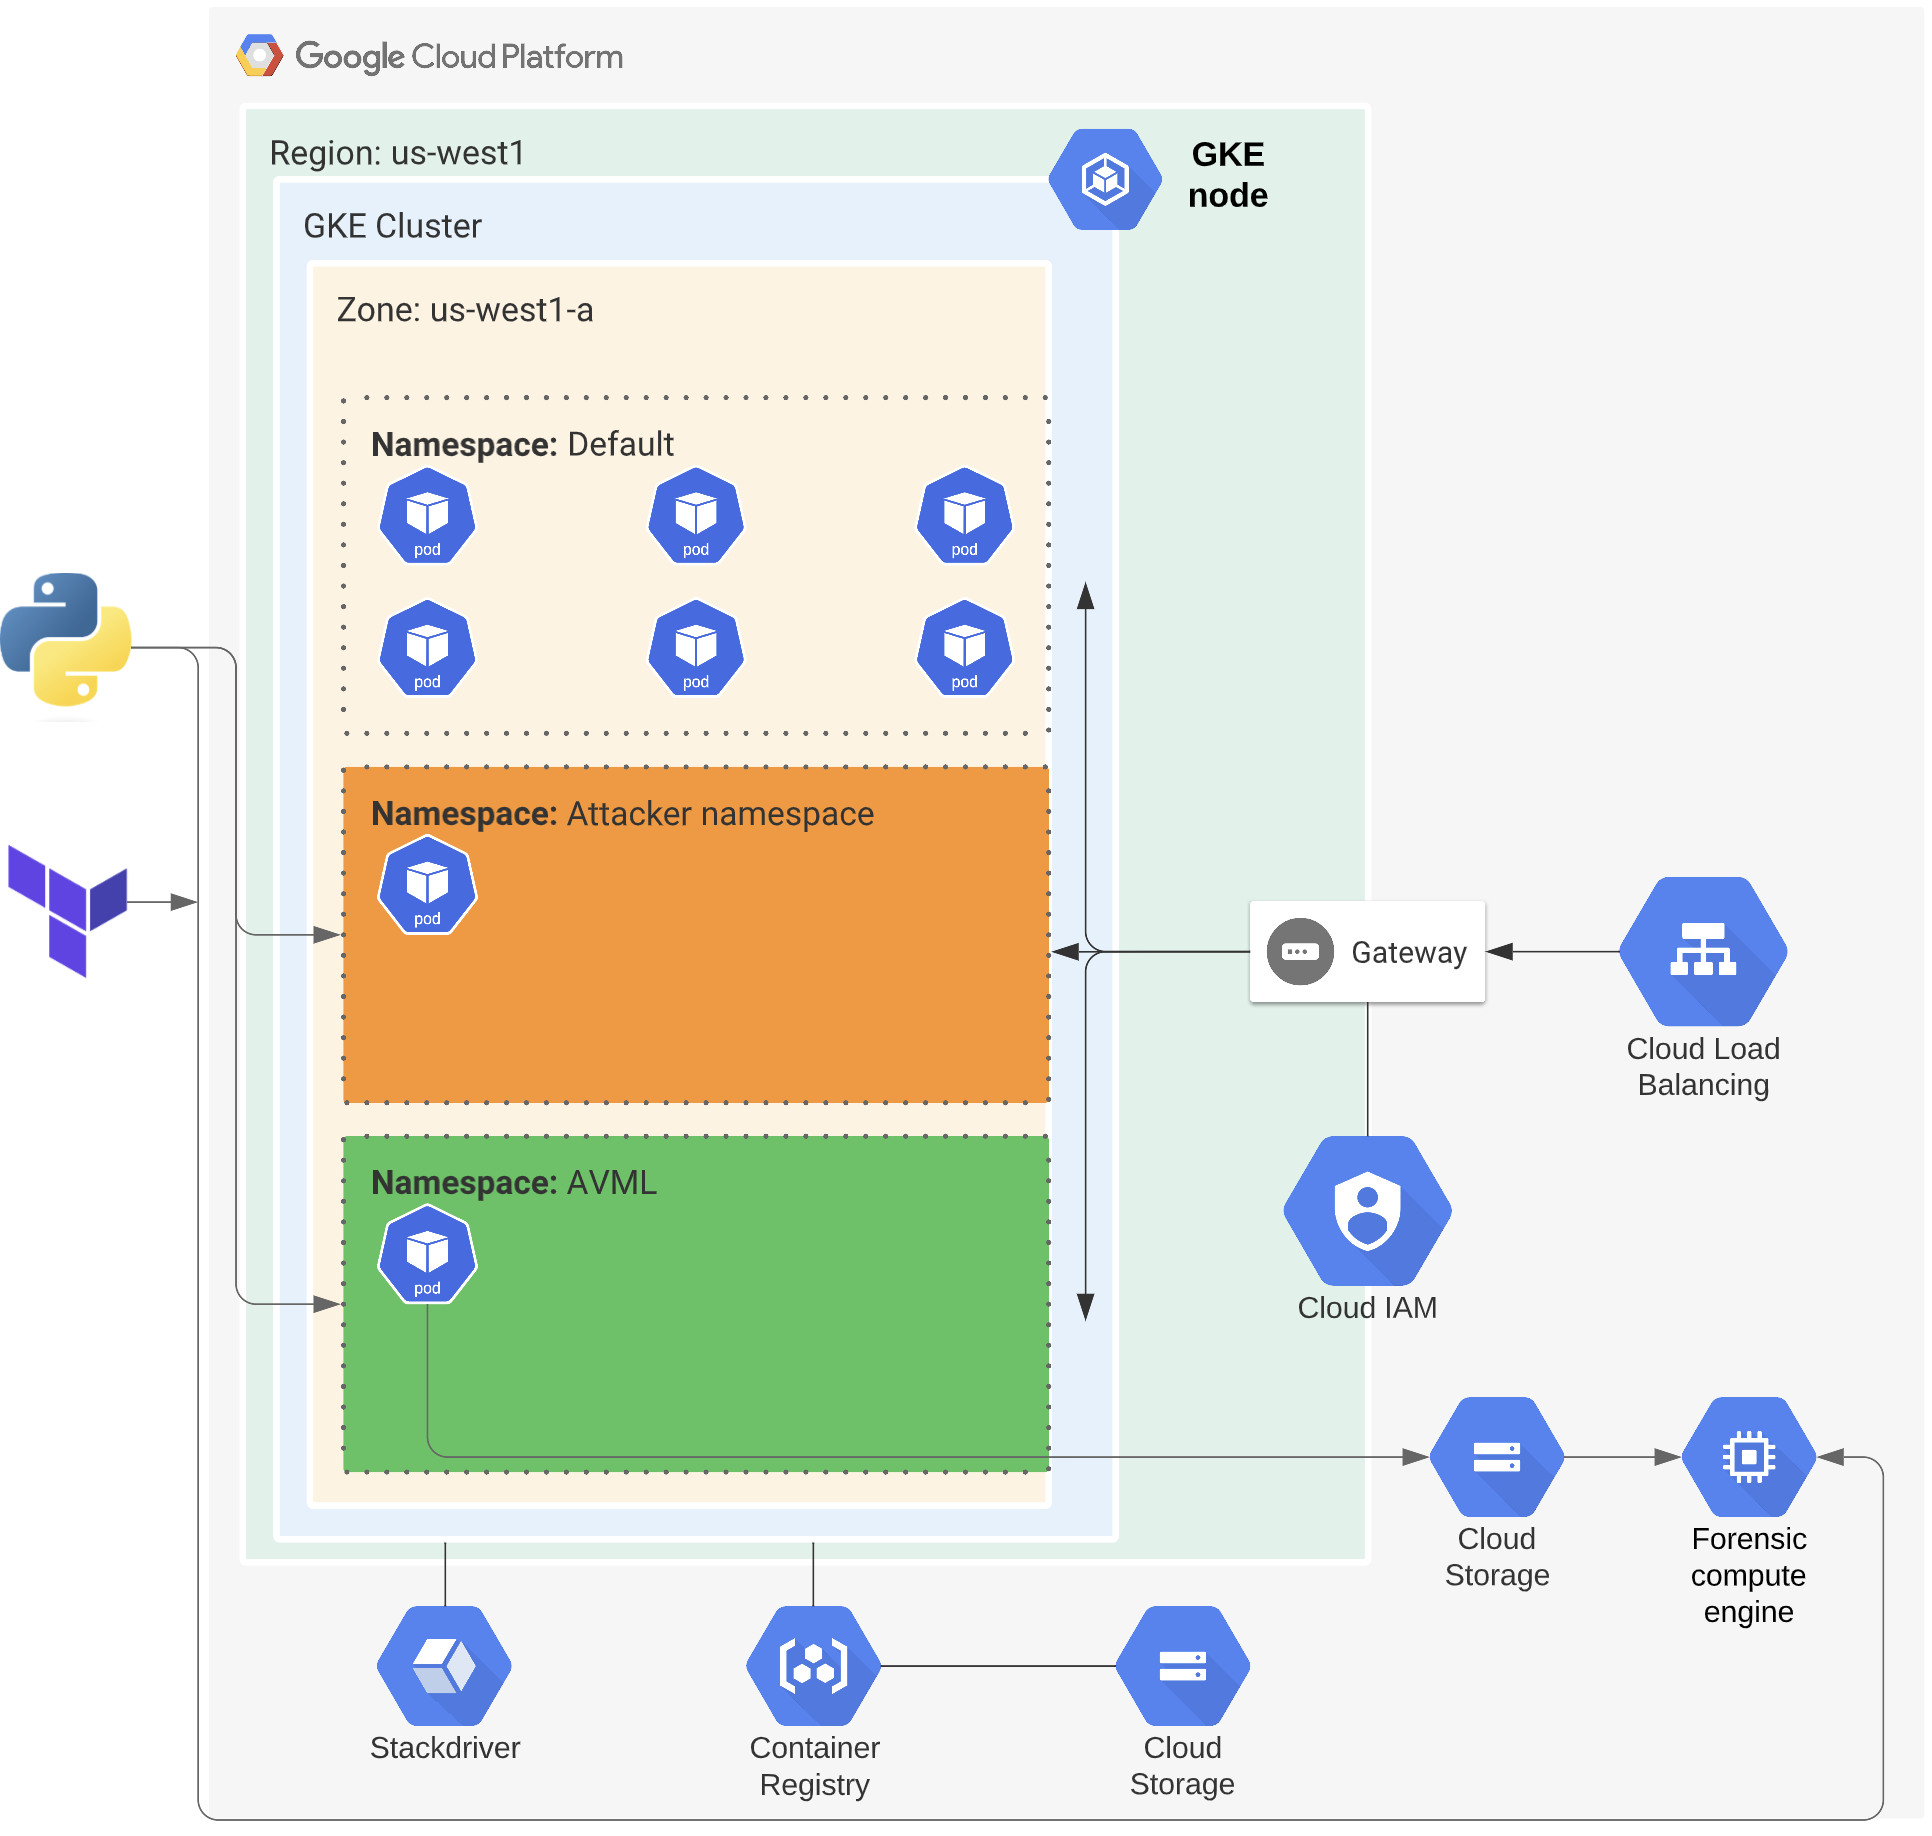
Figure 3: GCP architecture for GKE research.
Step 1: Create a kernel memory dump
By taking a kernel memory dump, we can get a “snapshot” of all the kernel activity at a specific time that we then can analyze.
Since GKE nodes are running the hardened operating system COS, we can’t use a kernel module or similar solution. However, by temporarily adding a privileged container to the GKE node with privileged permissions, we can access the kernel space in the file path: /proc/kcore.
Once we have access and can read from this file path, we can use the open source tool AVML to take a kernel memory dump. The code below shows a Terraform example of a privileged container in GKE.
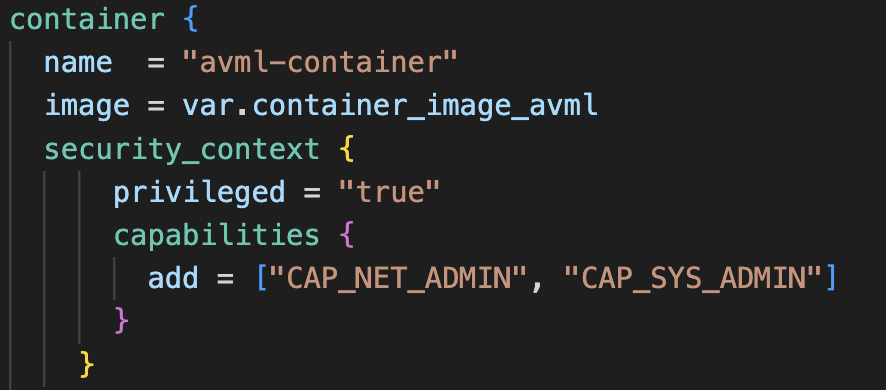
Figure 4: Terraform config of GKE container.
Step 2: Build a symbol file of the kernel
In order to interpret the kernel memory dump, we need to build an Intermediate Symbol File (ISF) of the actual kernel version of the GKE node. This can be done by accessing the vmlinux file, which is the uncompressed version of the kernel image, and then using an open source tool called dwarf2json to build the symbol file. With the symbol file, we can now interpret the kernel memory dump code into the running software and processes.
In our case, the problem was trying to find where Google Cloud hosts the vmlinux file of the COS version of a GKE node. After much research and interaction with some of Google’s engineers who build GKE and COS, we discovered an undocumented API that lets you access the vmlinux file if you know the build_id of the COS version running on your GKE node.
As the build_id is present in the GKE image name, we can find it and use it to access the API via the following link: https://storage.googleapis.com/cos-tools/$build_id/vmlinux.
In the example below, you’ll see that the GKE image has the build_id = 16919.235.1.
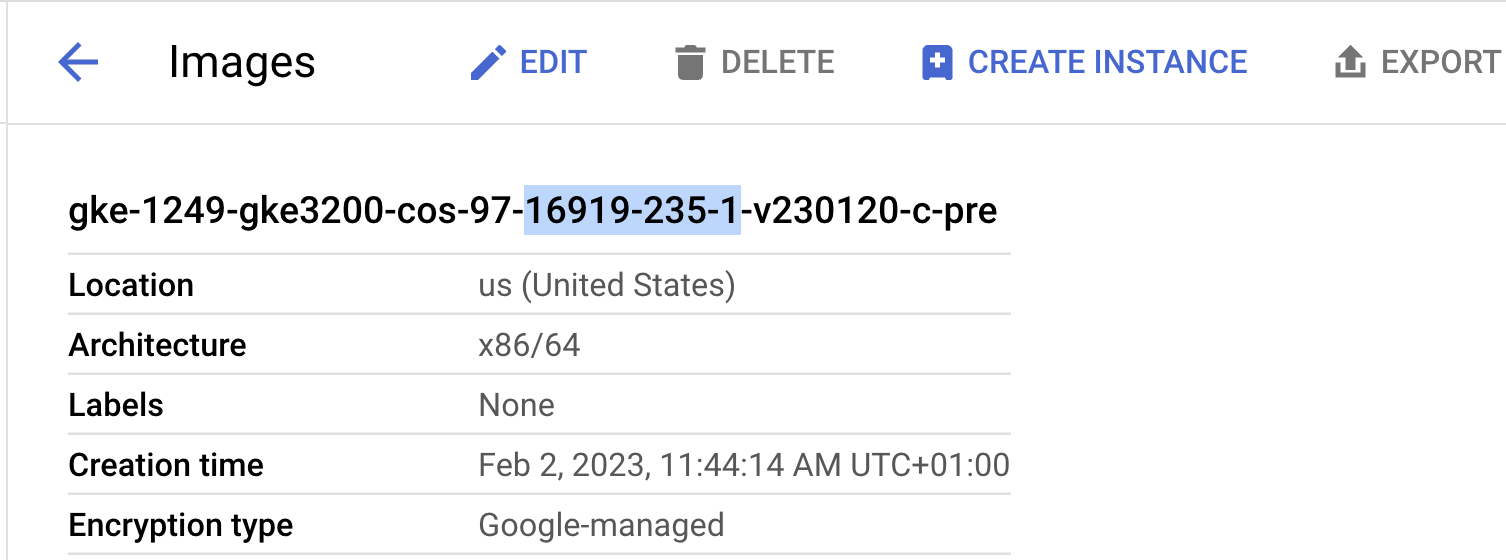
Figure 5: GKE image configuration, including build_id.
With this knowledge, we can access the vmlinux file via:
https://storage.googleapis.com/cos-tools/16919.235.1/vmlinux
and build the symbol file using dwarf2json.
Step 3: Analyze the kernel memory dump
Now that we finally have both the kernel memory dump and the symbol file to interpret that kernel version, we can now analyze it with Volatility 3. Using Volatility 3 allows us to see all running processes on both the privileged pod and another test pod on the same GKE node. This “attacker” pod is running a series of test processes to create some examples for us to analyze (for example, a Netcat listener, a watch command that queries the local IP and finally a Python script). Below, you can see the complete process output from the kernel memory dump analysis.
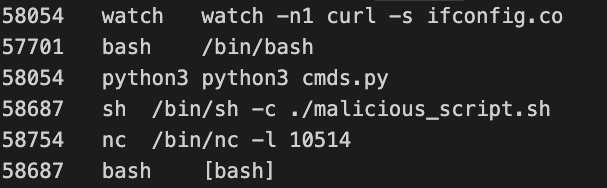
Figure 6: Process output from Volatility 3.
In summary, we can now see all the processes on the entire GKE node for all running pods.
Conclusion
Using the three tools mentioned above has provided us with free and open source alternatives to preexisting commercial solutions for monitoring containerized workloads. Although this approach provides a snapshot of the process activity, it can be used either as a starting point for memory analysis in GKE or as a complement to existing commercial solutions.
All the code used in this research project is available here on GitHub and was also presented at BSidesNYC 2023.
Kubernetes is a registered trademark of the Linux Foundation in the United States and other countries.
SHARE THIS ARTICLE