Risk-Aware Product Decisions in A/B Tests with Multiple Metrics
TL;DR We summarize the findings in our recent paper, Schultzberg, Ankargren, and Frånberg (2024), where we explain how Spotify’s decision-making engine works and how the results of multiple metrics in an A/B test are combined into a single product decision. Metrics can be of different types, and we consider success metrics (superiority tests), guardrail metrics (non-inferiority tests), deterioration metrics (inferiority tests), and quality metrics (various tests). We show that false positive rates shouldn’t be adjusted for guardrail metrics. However, to obtain the intended power, false negative rates must be corrected for the number of guardrail metrics and the number of other quality tests used. We also present a decision rule that includes all four types of metrics and propose a design and analysis strategy. Our approach controls the risks that incorrect decisions may have on this decision rule under any data-generating process. The decision rule also serves as an important tool for standardizing decision-making across the company.
Product development is a risky business
Product development is a risky business. If you don’t evolve your product quickly enough, competitors will outrun you. If you change your product in ways users don’t appreciate, you’ll lose them. Modern product development is all about taking calculated risks — some companies have a lot to gain and iterate quickly with greater risks, while others have more to lose and want to iterate in a more controlled fashion with lower risks. Front and center to any strategy isrisk — and the extent to which we can manage the risks of potentially bad product decisions.
Proposed changes are tested through randomized experiments, minimizing the risk of incorrect decisions and guiding well-informed product decisions. Tools like experimental design and statistical analysis are crucial for risk management. When we built the first version of the decision engine in Spotify’s experimentation platform back in early 2020, we started from first principles. We studied how experimenters use the different kinds of metrics and tests that the experimentation platform provides. We then formalized a decision rule according to that process and derived the corresponding design and analysis required to control the false positive and false negative risks of that decision rule.
As our experimentation platform — Confidence — becomes publicly available, we’re sharing the details of our risk management approach in Schultzberg, Ankargren, and Frånberg (2024). In this publication, we emphasize the importance of aligning experimental design and analysis with the decision rule to limit incorrect product decisions. We also show the decision rule Spotify uses and explain how you can start using our decision-rules engine via Confidence.
Decision rules help standardize and democratize experiment results
By articulating the heuristics that govern your decision-making process, you can design and analyze the experiment in a way that respects how you make decisions in the end. That’s not the only benefit of applying decision rules, though. There are two other key perks of the decision-rule framework that stand out, particularly when considering an experimentation platform as a centralized tool.
The first advantage is that a coherent and exhaustive way of automatically analyzing experiments is crucial for standardizing product decisions made from A/B tests. A major factor in the development of our new experimentation platform back in 2019 was the time-consuming, manual effort required to run analyses — we lacked a standardized, common approach to analyzing our experiments. Fast-forward to our new platform, where our analysis is fully automated. Combined with our decision rules, we not only achieve automation of experiment analyses, but also standardization of what we believe a successful experiment looks like.
A second advantage is that because the decision rule exhaustively maps all possible outcomes to a decision, we can give constructive guidance on the product implication of the results — without having to dive into any specific metric results. This provides us with an incredible opportunity to democratize the results of the experiments. Anyone, regardless of interest or experience with statistical results, can get a reading on the experiment. Experimentation is, and should be, a team sport. This reduces the need for data science expertise to correctly interpret experiment results.
A refresher on risk management
Before venturing into more detail on how we incorporate the decision rule into the design and analysis of our experiments, we’ll first present a brief refresher on our risk management strategy for product decisions. You may not think of null hypothesis significance testing as a risk management tool, but that’s precisely what it is. We plan an experiment to control the risk of a false-positive or false-negative result. We typically use alpha (α) to denote the intended risk for a false-positive result, and beta (β) for the risk of a false-negative result, where 1 – β is the intended power.
Our goal is as follows:
To limit the rate at which we ship changes that seem to improve the user experience when, in fact, they don’t
To limit the rate at which we don’t ship changes because they don’t seem to have the intended effect when, in fact, they do
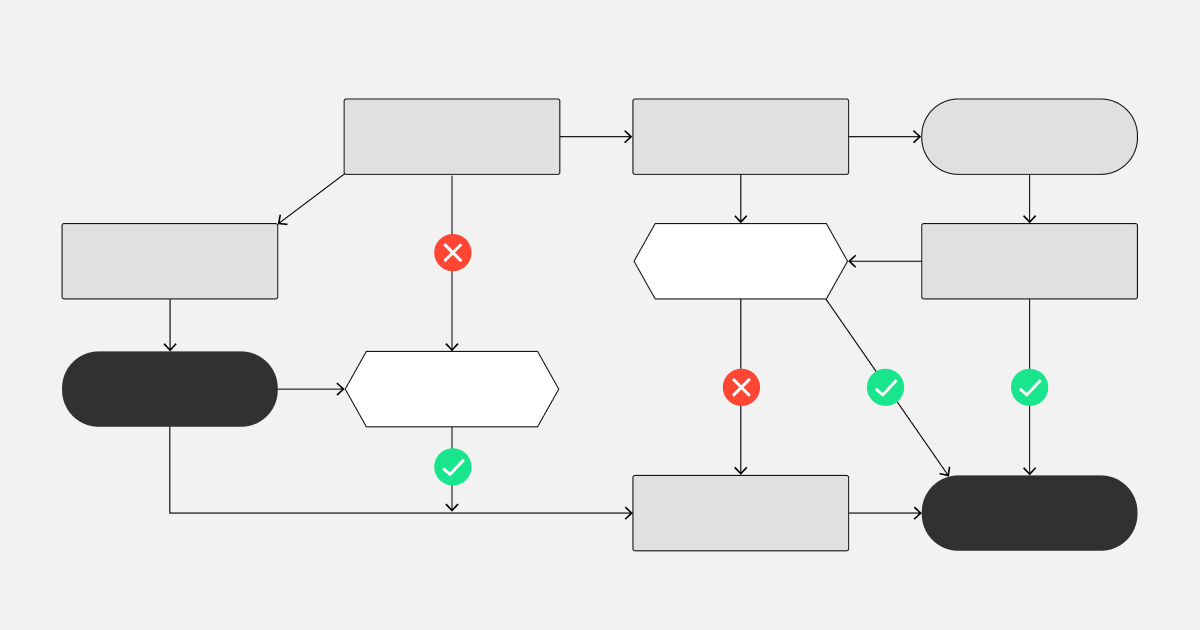
Over a program of many experiments, we can make sure that the rates at which we make the correct and incorrect decisions are bounded. The key is to power the experiments and to stick to the preplanned analysis. The following image illustrates this.

Figure 1: The four decisions that can be made based on an experiment and the intended rates for each. The correct decisions are marked in green: when we ship and the treatment truly has the intended effect, and when we don’t ship and the treatment truly doesn’t have any effect. The incorrect decisions are marked in red: when we ship the change but there truly is no effect, and when we don’t ship but there truly is an effect.
Decision rules as a way of mapping experiment results to a product decision
Going from the individual results of multiple metrics to a product decision is hard. For example, it’s common that an experiment positively impacts some metrics while others remain unchanged. Or positively impacts certain metrics while others deteriorate. In situations like these, the decision-making process often becomes ad hoc and varies widely across experiments, forgoing the scientific mindset that went into setting up the experiment in the first place. Unless you explicitly define how you plan to map the results of all metrics in an experiment to your shipping decision, you’ll rarely succeed in controlling the risk of what truly matters — the rates at which you make the correct decisions about your product. Luckily, through a structured and well-crafted experimental approach, we can learn what’s impactful while maintaining strong statistical risk guarantees.
To effectively manage the risk, the decision rule must be explicit, and the experiment must be designed and analyzed with the rule in mind. For example, in experiments with multiple metrics, a common way to maintain false-positive risk at an experiment level is multiple testing correction, which is second nature for many experimenters. However, it’s rarely acknowledged that these corrections are intimately tied to an implicit decision rule where you’ll ship if any metric moves. Clearly, this rule is insufficient when, for example, metrics move in conflicting directions.
Aspects that should go into a decision rule
At Spotify, we include four types of metrics and tests in our default product-shipping decision recommendations:
Success metrics. Metrics that we aim to improve, tested with superiority tests.
Guardrail metrics. Metrics that we don’t expect to improve, but we want evidence that they’re not deteriorating by more than a certain margin. Tested with non-inferiority tests.
Deterioration metrics. Metrics that shouldn’t deteriorate, tested with inferiority tests. Can also include success and guardrail metrics.
Quality metrics and tests. Metrics and tests that validate the quality of the experiment itself, like tests for sample ratio mismatch and pre-exposure bias.
Success and guardrail metrics aim to collect evidence that the change leads to a desirable outcome and without unanticipated side effects. The deterioration and quality metrics help validate the integrity of the experiment by identifying broken experiences, bugs, and misconfigured implementations.
Based on the outcomes of the tests for these metrics, we recommend a decision. The decision rule used at Spotify and in Confidence is as follows.
Ship if and only if:
The treatment is significantly superior to control on at least one success metric.
The treatment is significantly non-inferior to control on all guardrail metrics.
No success, guardrail, or deterioration metrics show evidence of deterioration.
No quality test significantly invalidates the quality of the experiment.
In other words, the experiment must show no indications of a lack of quality or harmful side effects. Moreover, the product change must make sense from a business perspective. The test must prove that all guardrail metrics are non-inferior and that there is at least one metric that improves. We believe this decision rule is a natural bar for a successful experiment. The main takeaway, however, is that whatever your preferred decision rule is, you must consider it in the design and the analysis of your experiments. If you don’t, all bets are off for the risk management of your product development. Of course, there’ll always be situations where this decision rule isn’t appropriate — for example, when the decision is based partly on external factors that can’t be modeled in the experiment. However, we find that for the bulk of experiments, this is a pragmatic way of modeling decision-making and controlling its risk.
How to design and analyze experiments to bound the risks of the decision rule
Next, we’ll briefly discuss the main statistical aspects of bounding the error rates of the decision rule. For a detailed description, see Schultzberg, Ankargren, and Frånberg (2024). We start by building intuition for some of the key elements of the design and analysis for the complete decision rule.
You shouldn’t correct the false-positive rate for guardrails…
Most people working with A/B testing know the importance of multiple testing correction to avoid inflating the false-positive rate. However, the rationale for these corrections changes as soon as we involve guardrail metrics, where we want to guard against deterioration by proving non-inferiority. In this case, we want the treatment to be significantly non-inferior to control for all guardrail metrics. There are no longer multiple chances in a way that motivates the use of multiple testing corrections.
For an experiment with only success and guardrail metrics, the relevant part of the decision rule is to ship if the following are true:
The treatment is significantly superior to control on at least one success metric.
The treatment is significantly non-inferior to control on all guardrail metrics.
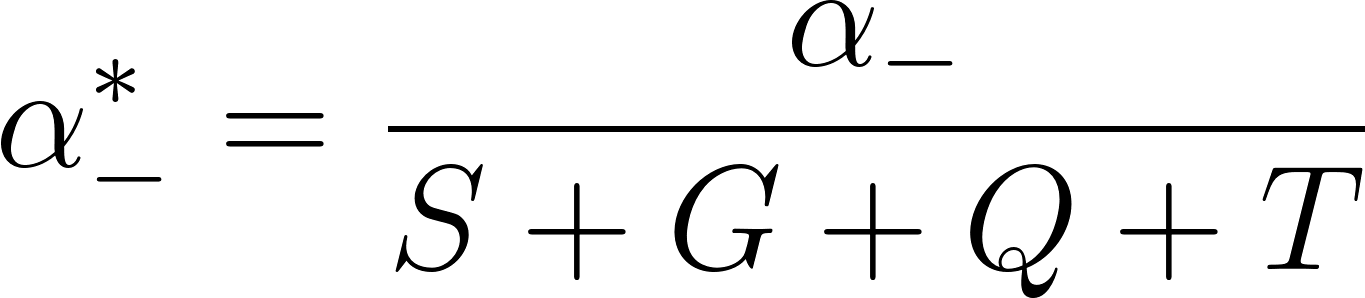
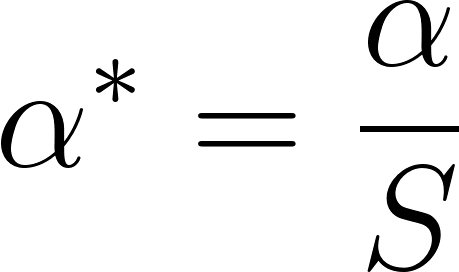
Under this rule, you only need to adjust the false-positive rate for the number of success metrics, because that’s the only group of metrics in which you have multiple chances. This means that we use

for success metrics and
 for guardrail metrics.
In Schultzberg, Ankargren, and Frånberg (2024), we also discuss the effect of deterioration and quality tests in detail. In short, they only affect the bounds of the false-negative rate, which leads us to the next section.
But you should adjust the power level for your guardrails
Power corrections (or beta corrections) are surprisingly absent from the online experimentation literature, especially considering the widespread awareness of the fallacies of underpowered experiments. Given the need for the treatment to be non-inferior on all the guardrail metrics and superior on at least one success metric, these events need to have a simultaneous probability of at least
 . As an example, suppose that the guardrail metrics are independent, and each metric is powered to meet
. In this scenario, the probability that all guardrail metrics are simultaneously significant quickly approaches zero as the number of guardrail metrics (
. As an example, suppose that the guardrail metrics are independent, and each metric is powered to meet
. In this scenario, the probability that all guardrail metrics are simultaneously significant quickly approaches zero as the number of guardrail metrics (
 ) increases. Figure 2 displays this relation under independence between the guardrail metrics. Already, with 5 guardrail metrics, the simultaneous power is way below 40%, and for 10 guardrail metrics, it’s around 11%.

In Schultzberg, Ankargren, and Frånberg (2024), we show that we can mitigate the loss of power by correcting the level we power each metric for. If we power each metric for
 ,
,
where
is the number of guardrail metrics, the power of the decision is at least
.
Deterioration and quality metrics give you fewer chances of finding success
At Spotify, we include certain critical business metrics as deterioration metrics in all experiments, which we test for inferiority. These inferiority tests are applied to all metrics in an experiment to detect significant deterioration, indicating the treatment’s inferiority to the control. Deterioration tests are crucial for identifying regressions that could impact an experiment’s success. Inferiority tests for these metrics help pinpoint significant regressions, complementing the existing superiority and non-inferiority tests in the decision rule.
Quality metrics, like tests for sample ratio mismatch and pre-exposure bias, are integral to any advanced experimentation tool to validate the quality of the experiment. Incorporating deterioration and quality metrics makes the decision rule more conservative, adding opportunities to stop the experiment. In the next section, we show how to adjust the design to provide the intended power for the decision rule.
A complete design and analysis strategy to bound the error rates of the decision rule
First, let’s repeat our decision rule.
Ship if and only if:
The treatment is significantly superior to control on at least one success metric.
The treatment is significantly non-inferior to control on all guardrail metrics.
No success, guardrail, or deterioration metrics show evidence of deterioration.
No quality test significantly invalidates the quality of the experiment.
Using what we’ve learned, we employ the following risk strategy and correction to obtain at most the intended false-positive rate, and at least the intended power. Let S and
be the number of success and guardrail metrics, respectively. All success and guardrail metrics are also tested for deterioration. Let D be the additional number of metrics tested for deterioration, and let Q be the number of tests for quality.Let
 and
and
 be the intended false-positive and false-negative rates for the overall product decision, and
 be the intended false-positive rate for the deterioration and quality tests. To make sure that the false-positive and false-negative risks for the decision don’t exceed the intended levels, use the following:
For all deterioration and quality tests, use
 .
.For the superiority tests for success metrics, use
 .
.For the non-inferiority tests for guardrail metrics, use
 .
.For all non-inferiority tests and superiority tests, use


 .
.
Using the above corrections, the false-positive and false-negative rates won’t exceed the intended levels for the decision under any covariance structure. See Schultzberg, Ankargren, and Frånberg (2024) for a formal proof.
For common empirical values of
 , such as 1%, the effect of the deterioration and quality tests on the beta correction is negligible. To simplify, we can leave out their contribution to the correction and still achieve empirical false-positive and false-negative rates that don’t exceed our intended levels under the correlation structures we often see in practice.
Conclusion
In summary:
To limit the risks of incorrect product decisions based on experiment results, it’s crucial to have an explicit decision rule that maps the results from all statistical tests used in an A/B test to a product decision.
Different decision rules require different experimental designs and statistical analyses to limit the risks of making the wrong decisions.
Multiple testing corrections for false-positive rates are widely accepted and used. We show that false-positive rates shouldn’t be corrected for guardrail metrics. Moreover, we introduce beta corrections, which are essential for powering the product decision rule when your experiment includes guardrail metrics.
Not having a one-to-one mapping between your decision rule on the one hand, and the experimental design and statistical analysis on the other, often implies that the risks of making the wrong decisions aren’t what you think they are.
Unless you match your design and analysis with how you’re making decisions based on your experiment results, you aren’t controlling the risks of making the wrong decision as you intend. With Confidence, you can quickly get started with analyses of experiments using decision rules to help you automate, standardize, and democratize experiment results in your organization. Our buy-and-build principle makes it possible for you to customize how you analyze your experiments.
Get access to Spotify’s decision engine via Confidence By default, Confidence analyzes experiments using the decision rules previously presented. Your analyses are always adjusted for multiple testing, but according to the shipping decision as described in the section above. Confidence provides each treatment with a shipping recommendation that summarizes the state of the experiment. It gives you a recommendation for what to do and shows you how each piece of the decision rule contributes to the current recommendation. Want to learn more about Confidence? Check out the Confidence blog for more posts on Confidence and its functionality. Confidence is currently available in private beta. If you haven’t signed up already, sign up today, and we’ll be in touch.
SHARE THIS ARTICLE