Painting a Picture of Your Infrastructure in Minutes
As a Security responder, it is important to have access to relevant information quickly in order to get a more complete picture of an ongoing or potential incident. Modern microservice architecture usually means that the number of services, and thus hosts and related assets, are much higher than they used to. This means that getting an overview of them is no longer a trivial task and as resources become more and more ephemeral, the inventory is not only large in volume but it’s also rapidly changing.
As most of Spotify’s production resources are hosted in Google Cloud, we wanted to provide a complete, up-to-date, and quick view into all of the things that make up our backend, with the ability to query and slice it in an easy way. We started by simply scraping the Google Cloud APIs to get all the resources for all of our projects, but this meant handling API failure responses and rate limiting. With the introduction of the Cloud Asset Inventory Google was able to provide an API to get all of the data we needed with one simple API call. Yay! Read more about it in Google’s recent blog post.
Now that all the data was available to us in a matter of minutes, we needed to process it to get it to the point where it was quick and easy to query. We noticed that almost all resources are connected to other resources in some way, for example: a Compute Instance is hosted within a Project, a Firewall Rule belongs to a Network and applies to a set of Instances. As a result, we realized that this data would be best understood as a graph.
During a Spotify Hack Day, our team (Cloud Security) decided to quickly make a prototype implementation of a processing step that took the data and modeled it into a graph. We settled on using Neo4j as the Graph database and a quick-and-dirty Python script to massage the Cloud Asset Inventory data into a format that could be used by the Neo4j import tooling. After only one day we had a proof of concept that could construct a graph with a subset of the resources available in the asset inventory dump.
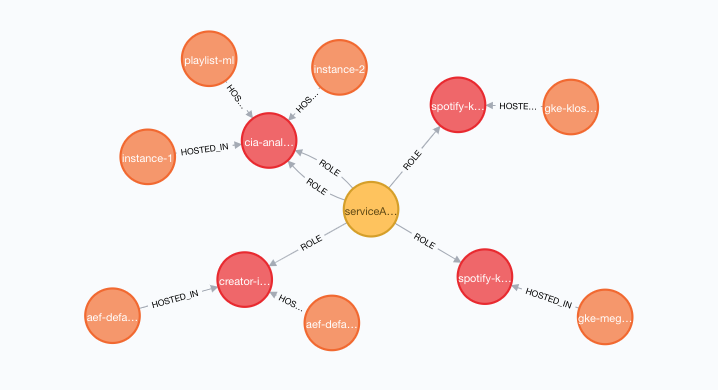
Next we decided to take it for a spin by asking questions about the graph to the graph database. Below we can see a graph query, in the Cypher language, that shows us all compute instances that are part of a project where the secret@iam.gserviceaccount.com service account is an owner.
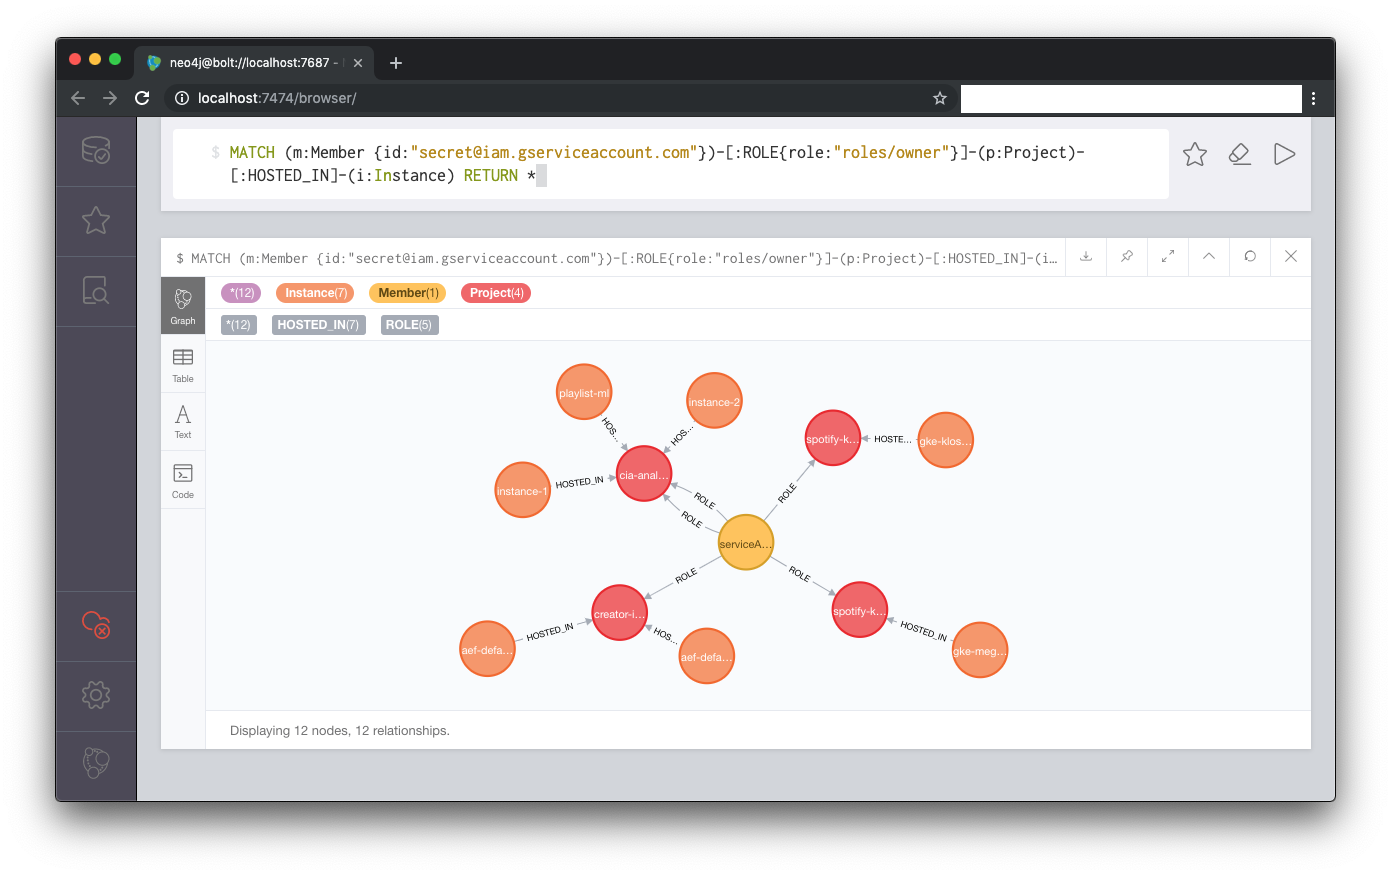
The cool part is that it only takes a couple of minutes from calling the Google Cloud Asset Inventory export API to having the complete graph of the inventory, ready for querying!
We are very excited about the possibilities of the Cloud Asset Inventory and the power of having asset inventorization integrated right into the Google Cloud platform. Other use cases we have been thinking about that can leverage the Cloud Asset Inventory data are to clean up unused resources (like networks without any instance attached) or making continuous queries to verify security or compliance criteria.
We also realized that we were not the first to have the idea of inventorize in a graph and would like to give a shout out to the following open source projects that had similar ideas:
https://github.com/IntelLabsEurope/landscaper/
https://github.com/GoogleCloudPlatform/professional-services/tree/master/tools/asset-inventory
https://github.com/lyft/cartography/
Tags: backend


